29
/
en
AIzaSyAYiBZKx7MnpbEhh9jyipgxe19OcubqV5w
April 1, 2024
54761
Post-demographic dividend
PST
false
2
1
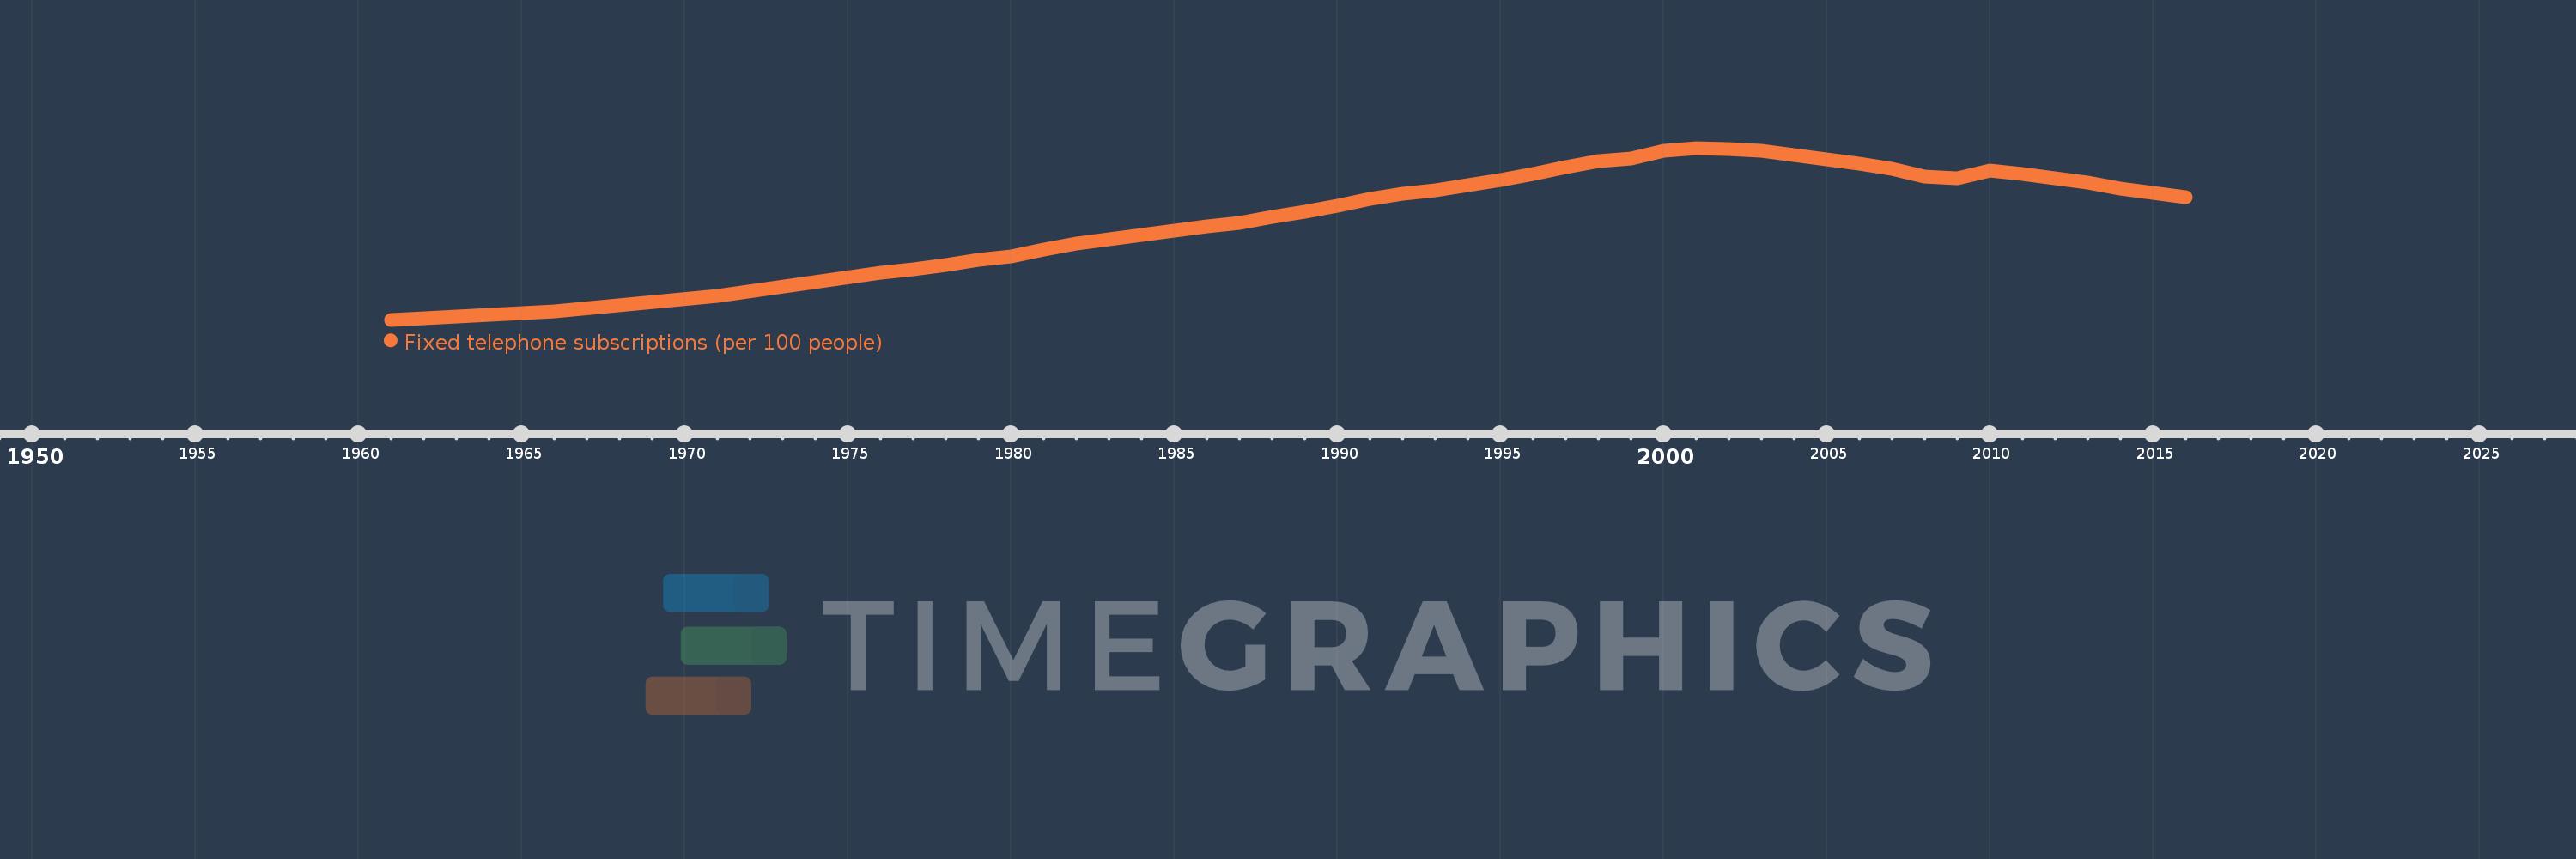
Fixed telephone subscriptions (per 100 people)
2016,2015,2014,2013,2012,2011,2010,2009,2008,2007,2006,2005,2004,2003,2002,2001,2000,1999,1998,1997,1996,1995,1994,1993,1992,1991,1990,1989,1988,1987,1986,1985,1984,1983,1982,1981,1980,1979,1978,1977,1976,1971,1966,1961
This statistics in other country:
AfghanistanAlbaniaAlgeriaAmerican SamoaAndorraAngolaAntigua and BarbudaArab WorldArgentinaArmeniaArubaAustraliaAustriaAzerbaijanBahamas, TheBahrainBangladeshBarbadosBelarusBelgiumBelizeBeninBermudaBhutanBoliviaBosnia and HerzegovinaBotswanaBrazilBritish Virgin IslandsBrunei DarussalamBulgariaBurkina FasoBurundiCabo VerdeCambodiaCameroonCanadaCaribbean small statesCayman IslandsCentral African RepublicCentral Europe and the BalticsChadChileChinaColombiaComorosCongo, Dem. Rep.Congo, Rep.Costa RicaCote d'IvoireCroatiaCubaCuracaoCyprusCzech RepublicDenmarkDjiboutiDominicaDominican RepublicEarly-demographic dividendEast Asia & PacificEast Asia & Pacific (excluding high income)East Asia & Pacific (IDA & IBRD countries)EcuadorEgypt, Arab Rep.El SalvadorEquatorial GuineaEritreaEstoniaEthiopiaEuro areaEurope & Central AsiaEurope & Central Asia (excluding high income)Europe & Central Asia (IDA & IBRD countries)European UnionFaroe IslandsFijiFinlandFragile and conflict affected situationsFranceFrench PolynesiaGabonGambia, TheGeorgiaGermanyGhanaGibraltarGreeceGreenlandGrenadaGuamGuatemalaGuineaGuinea-BissauGuyanaHaitiHeavily indebted poor countries (HIPC)High incomeHondurasHong Kong SAR, ChinaHungaryIBRD onlyIcelandIDA & IBRD totalIDA blendIDA onlyIDA totalIndiaIndonesiaIran, Islamic Rep.IraqIrelandIsraelItalyJamaicaJapanJordanKazakhstanKenyaKiribatiKorea, Dem. People’s Rep.Korea, Rep.KosovoKuwaitKyrgyz RepublicLao PDRLate-demographic dividendLatin America & Caribbean Latin America & Caribbean (excluding high income)Latin America & the Caribbean (IDA & IBRD countries)LatviaLeast developed countries: UN classificationLebanonLesothoLiberiaLibyaLiechtensteinLithuaniaLow & middle incomeLow incomeLower middle incomeLuxembourgMacao SAR, ChinaMacedonia, FYRMadagascarMalawiMalaysiaMaldivesMaliMaltaMarshall IslandsMauritaniaMauritiusMexicoMicronesia, Fed. Sts.Middle East & North AfricaMiddle East & North Africa (excluding high income)Middle East & North Africa (IDA & IBRD countries)Middle incomeMoldovaMonacoMongoliaMontenegroMoroccoMozambiqueMyanmarNamibiaNauruNepalNetherlandsNew CaledoniaNew ZealandNicaraguaNigerNigeriaNorth AmericaNorthern Mariana IslandsNorwayOECD membersOmanOther small statesPacific island small statesPakistanPalauPanamaPapua New GuineaParaguayPeruPhilippinesPolandPortugalPost-demographic dividendPre-demographic dividendPuerto RicoQatarRomaniaRussian FederationRwandaSamoaSan MarinoSao Tome and PrincipeSaudi ArabiaSenegalSerbiaSeychellesSierra LeoneSingaporeSlovak RepublicSloveniaSmall statesSolomon IslandsSomaliaSouth AfricaSouth AsiaSouth Asia (IDA & IBRD)South SudanSpainSri LankaSt. Kitts and NevisSt. LuciaSt. Vincent and the GrenadinesSub-Saharan Africa Sub-Saharan Africa (excluding high income)Sub-Saharan Africa (IDA & IBRD countries)SudanSurinameSwazilandSwedenSwitzerlandSyrian Arab RepublicTajikistanTanzaniaThailandTimor-LesteTogoTongaTrinidad and TobagoTunisiaTurkeyTurkmenistanTurks and Caicos IslandsTuvaluUgandaUkraineUnited Arab EmiratesUnited KingdomUnited StatesUpper middle incomeUruguayUzbekistanVanuatuVenezuela, RBVietnamVirgin Islands (U.S.)West Bank and GazaWorldYemen, Rep.ZambiaZimbabwe Timeline:
This timeline shows a graph from 1961 to 2016 of Post-demographic dividend. No data until 1960. Number of actual observations by date: 44.
Source name:
World Development Indicators
Source organization:
International Telecommunication Union, World Telecommunication/ICT Development Report and database.
Categories, topics:
Infrastructure
Last updated:
apr 23, 2017
Indicators value changes by year
Minimum:
11.886
jan 1, 1961
Maximum:
55.017
jan 1, 2001
At the date of observation
Value
Absolute change
Change from previous value
jan 1, 1961
11.886
+11.886
0.0%
jan 1, 1966
14.052
+2.166
18.22%
jan 1, 1971
17.935
+3.883
27.63%
jan 1, 1976
23.589
+5.654
31.52%
jan 1, 1977
24.462
+0.874
3.7%
jan 1, 1978
25.66
+1.197
4.89%
jan 1, 1979
26.976
+1.316
5.13%
jan 1, 1980
27.864
+0.888
3.29%
jan 1, 1981
29.422
+1.558
5.59%
jan 1, 1982
31.107
+1.685
5.73%
jan 1, 1983
32.043
+0.936
3.01%
jan 1, 1984
33.132
+1.089
3.4%
jan 1, 1985
34.177
+1.045
3.15%
jan 1, 1986
35.265
+1.088
3.18%
jan 1, 1987
36.298
+1.033
2.93%
jan 1, 1988
37.598
+1.3
3.58%
jan 1, 1989
39.04
+1.442
3.83%
jan 1, 1990
40.57
+1.531
3.92%
jan 1, 1991
42.201
+1.631
4.02%
jan 1, 1992
43.424
+1.223
2.9%
jan 1, 1993
44.488
+1.064
2.45%
jan 1, 1994
45.695
+1.207
2.71%
jan 1, 1995
47.034
+1.339
2.93%
jan 1, 1996
48.552
+1.518
3.23%
jan 1, 1997
50.141
+1.589
3.27%
jan 1, 1998
51.72
+1.58
3.15%
jan 1, 1999
52.384
+0.664
1.28%
jan 1, 2000
54.244
+1.86
3.55%
jan 1, 2001
55.017
+0.773
1.42%
jan 1, 2002
54.7
-0.318
-0.58%
jan 1, 2003
54.224
-0.476
-0.87%
jan 1, 2004
53.141
-1.082
-2.0%
jan 1, 2005
52.13
-1.012
-1.9%
jan 1, 2006
51.085
-1.045
-2.0%
jan 1, 2007
49.858
-1.227
-2.4%
jan 1, 2008
47.747
-2.11
-4.23%
jan 1, 2009
47.478
-0.27
-0.57%
jan 1, 2010
49.299
+1.822
3.84%
jan 1, 2011
48.544
-0.755
-1.53%
jan 1, 2012
47.351
-1.193
-2.46%
jan 1, 2013
46.241
-1.11
-2.34%
jan 1, 2014
44.78
-1.461
-3.16%
jan 1, 2015
43.786
-0.994
-2.22%
jan 1, 2016
42.568
-1.218
-2.78%
Ranking of countries by current statistics by years


Comments: