29
/
en
AIzaSyAYiBZKx7MnpbEhh9jyipgxe19OcubqV5w
April 1, 2024
122102
Dominican Republic
DOM
true
2
1
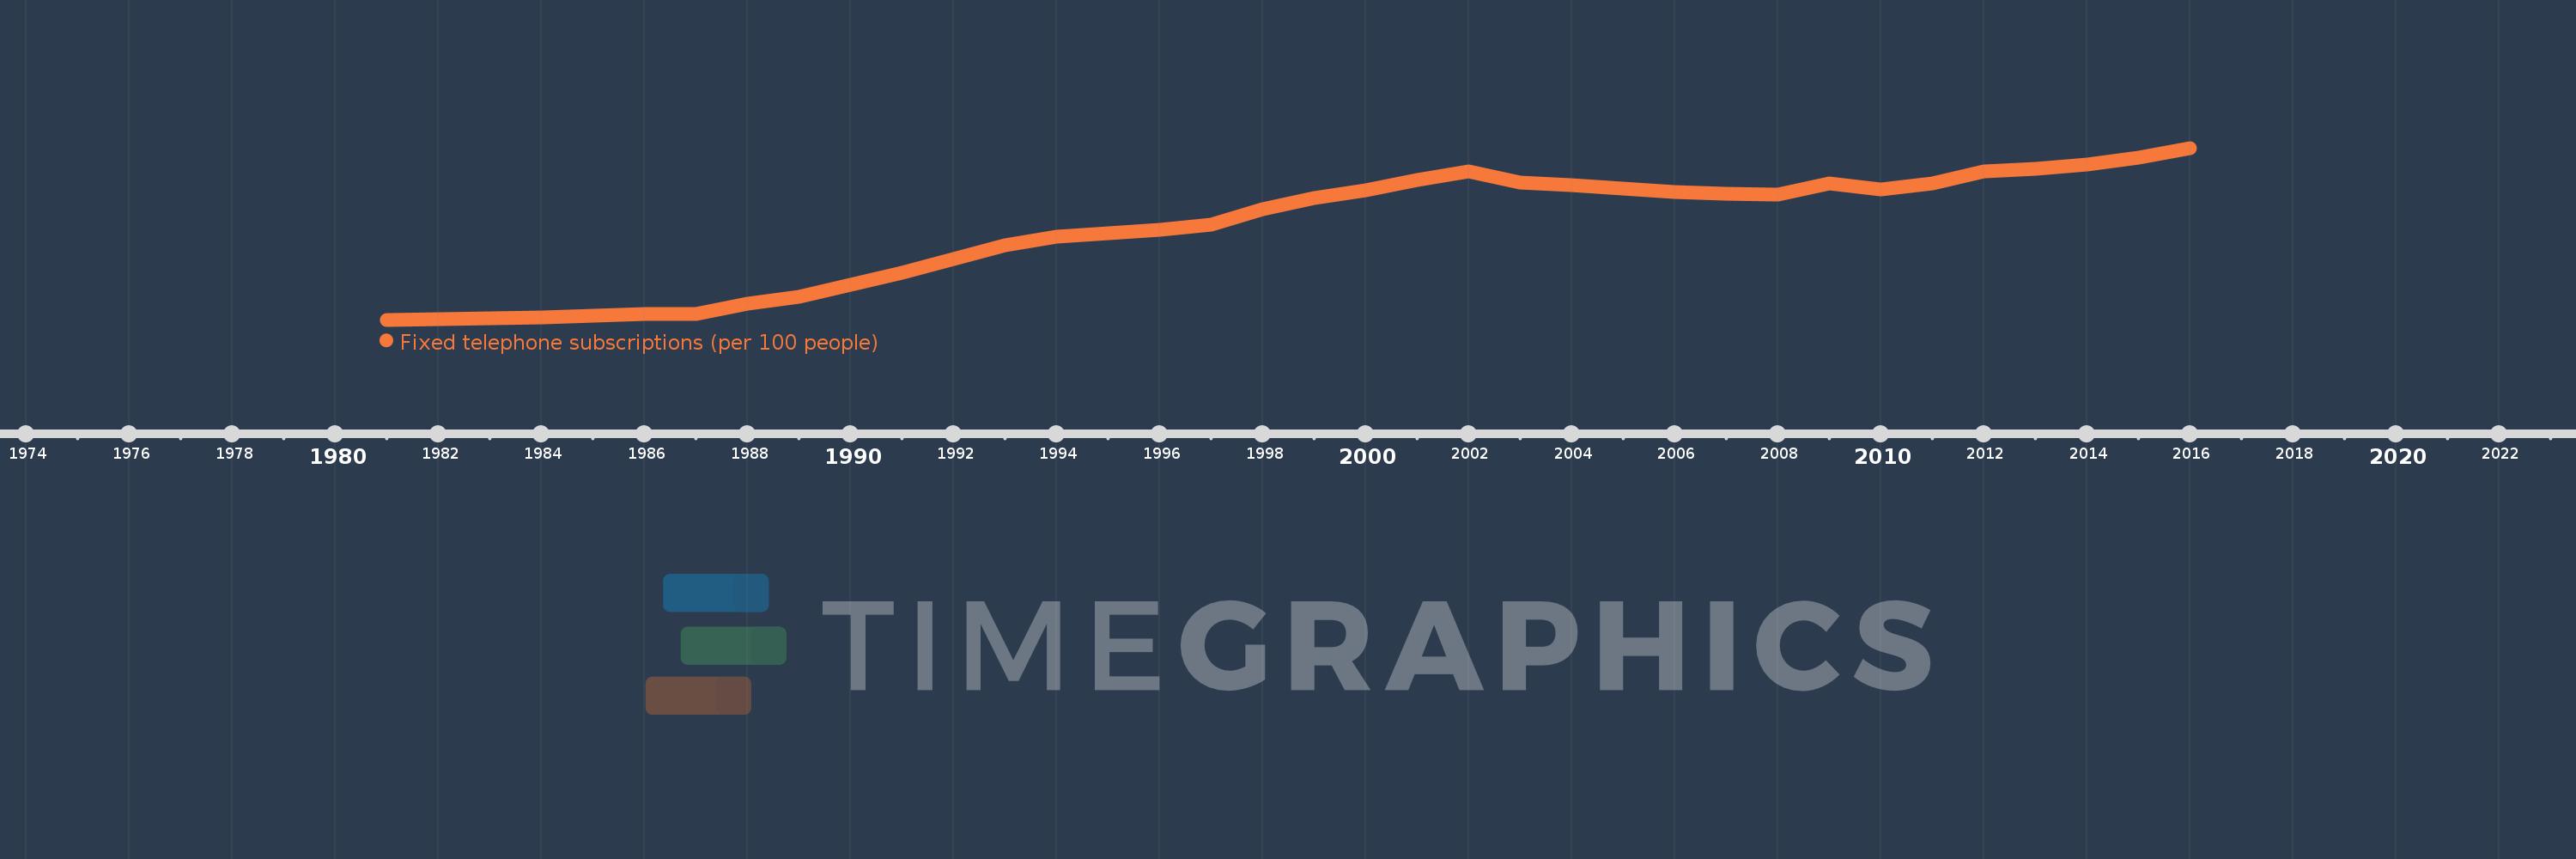
Fixed telephone subscriptions (per 100 people)
2016,2015,2014,2013,2012,2011,2010,2009,2008,2007,2006,2005,2004,2003,2002,2001,2000,1999,1998,1997,1996,1995,1994,1993,1992,1991,1990,1989,1988,1987,1986,1985,1984,1983,1982,1981
This statistics in other country:
AfghanistanAlbaniaAlgeriaAmerican SamoaAndorraAngolaAntigua and BarbudaArab WorldArgentinaArmeniaArubaAustraliaAustriaAzerbaijanBahamas, TheBahrainBangladeshBarbadosBelarusBelgiumBelizeBeninBermudaBhutanBoliviaBosnia and HerzegovinaBotswanaBrazilBritish Virgin IslandsBrunei DarussalamBulgariaBurkina FasoBurundiCabo VerdeCambodiaCameroonCanadaCaribbean small statesCayman IslandsCentral African RepublicCentral Europe and the BalticsChadChileChinaColombiaComorosCongo, Dem. Rep.Congo, Rep.Costa RicaCote d'IvoireCroatiaCubaCuracaoCyprusCzech RepublicDenmarkDjiboutiDominicaDominican RepublicEarly-demographic dividendEast Asia & PacificEast Asia & Pacific (excluding high income)East Asia & Pacific (IDA & IBRD countries)EcuadorEgypt, Arab Rep.El SalvadorEquatorial GuineaEritreaEstoniaEthiopiaEuro areaEurope & Central AsiaEurope & Central Asia (excluding high income)Europe & Central Asia (IDA & IBRD countries)European UnionFaroe IslandsFijiFinlandFragile and conflict affected situationsFranceFrench PolynesiaGabonGambia, TheGeorgiaGermanyGhanaGibraltarGreeceGreenlandGrenadaGuamGuatemalaGuineaGuinea-BissauGuyanaHaitiHeavily indebted poor countries (HIPC)High incomeHondurasHong Kong SAR, ChinaHungaryIBRD onlyIcelandIDA & IBRD totalIDA blendIDA onlyIDA totalIndiaIndonesiaIran, Islamic Rep.IraqIrelandIsraelItalyJamaicaJapanJordanKazakhstanKenyaKiribatiKorea, Dem. People’s Rep.Korea, Rep.KosovoKuwaitKyrgyz RepublicLao PDRLate-demographic dividendLatin America & Caribbean Latin America & Caribbean (excluding high income)Latin America & the Caribbean (IDA & IBRD countries)LatviaLeast developed countries: UN classificationLebanonLesothoLiberiaLibyaLiechtensteinLithuaniaLow & middle incomeLow incomeLower middle incomeLuxembourgMacao SAR, ChinaMacedonia, FYRMadagascarMalawiMalaysiaMaldivesMaliMaltaMarshall IslandsMauritaniaMauritiusMexicoMicronesia, Fed. Sts.Middle East & North AfricaMiddle East & North Africa (excluding high income)Middle East & North Africa (IDA & IBRD countries)Middle incomeMoldovaMonacoMongoliaMontenegroMoroccoMozambiqueMyanmarNamibiaNauruNepalNetherlandsNew CaledoniaNew ZealandNicaraguaNigerNigeriaNorth AmericaNorthern Mariana IslandsNorwayOECD membersOmanOther small statesPacific island small statesPakistanPalauPanamaPapua New GuineaParaguayPeruPhilippinesPolandPortugalPost-demographic dividendPre-demographic dividendPuerto RicoQatarRomaniaRussian FederationRwandaSamoaSan MarinoSao Tome and PrincipeSaudi ArabiaSenegalSerbiaSeychellesSierra LeoneSingaporeSlovak RepublicSloveniaSmall statesSolomon IslandsSomaliaSouth AfricaSouth AsiaSouth Asia (IDA & IBRD)South SudanSpainSri LankaSt. Kitts and NevisSt. LuciaSt. Vincent and the GrenadinesSub-Saharan Africa Sub-Saharan Africa (excluding high income)Sub-Saharan Africa (IDA & IBRD countries)SudanSurinameSwazilandSwedenSwitzerlandSyrian Arab RepublicTajikistanTanzaniaThailandTimor-LesteTogoTongaTrinidad and TobagoTunisiaTurkeyTurkmenistanTurks and Caicos IslandsTuvaluUgandaUkraineUnited Arab EmiratesUnited KingdomUnited StatesUpper middle incomeUruguayUzbekistanVanuatuVenezuela, RBVietnamVirgin Islands (U.S.)West Bank and GazaWorldYemen, Rep.ZambiaZimbabwe Timeline:
This timeline shows a graph from 1981 to 2016 of Dominican Republic. No data until 1980. Number of actual observations by date: 36.
Source name:
World Development Indicators
Source organization:
International Telecommunication Union, World Telecommunication/ICT Development Report and database.
Categories, topics:
Infrastructure
Last updated:
apr 23, 2017
Indicators value changes by year
Maximum:
12.251
jan 1, 2016
At the date of observation
Value
Absolute change
Change from previous value
jan 1, 1981
1.862
+1.862
0.0%
jan 1, 1982
1.91
+0.048
2.58%
jan 1, 1983
1.941
+0.03
1.59%
jan 1, 1984
2.008
+0.067
3.45%
jan 1, 1985
2.101
+0.093
4.65%
jan 1, 1986
2.203
+0.101
4.82%
jan 1, 1987
2.223
+0.02
0.92%
jan 1, 1988
2.84
+0.617
27.75%
jan 1, 1989
3.264
+0.424
14.94%
jan 1, 1990
4.001
+0.736
22.55%
jan 1, 1991
4.709
+0.709
17.72%
jan 1, 1992
5.554
+0.844
17.93%
jan 1, 1993
6.359
+0.805
14.5%
jan 1, 1994
6.893
+0.535
8.41%
jan 1, 1995
7.09
+0.196
2.85%
jan 1, 1996
7.303
+0.213
3.0%
jan 1, 1997
7.619
+0.316
4.33%
jan 1, 1998
8.531
+0.912
11.97%
jan 1, 1999
9.201
+0.669
7.85%
jan 1, 2000
9.695
+0.494
5.37%
jan 1, 2001
10.321
+0.627
6.46%
jan 1, 2002
10.855
+0.534
5.17%
jan 1, 2003
10.173
-0.682
-6.28%
jan 1, 2004
10.018
-0.154
-1.52%
jan 1, 2005
9.799
-0.219
-2.19%
jan 1, 2006
9.592
-0.207
-2.11%
jan 1, 2007
9.463
-0.129
-1.35%
jan 1, 2008
9.428
-0.035
-0.37%
jan 1, 2009
10.11
+0.682
7.23%
jan 1, 2010
9.767
-0.342
-3.39%
jan 1, 2011
10.112
+0.345
3.53%
jan 1, 2012
10.838
+0.726
7.18%
jan 1, 2013
10.986
+0.148
1.36%
jan 1, 2014
11.256
+0.27
2.46%
jan 1, 2015
11.645
+0.389
3.46%
jan 1, 2016
12.251
+0.606
5.2%
Ranking of countries by current statistics by years


Comments: