29
/
en
AIzaSyAYiBZKx7MnpbEhh9jyipgxe19OcubqV5w
April 1, 2024
36551
IBRD only
IBD
false
2
1
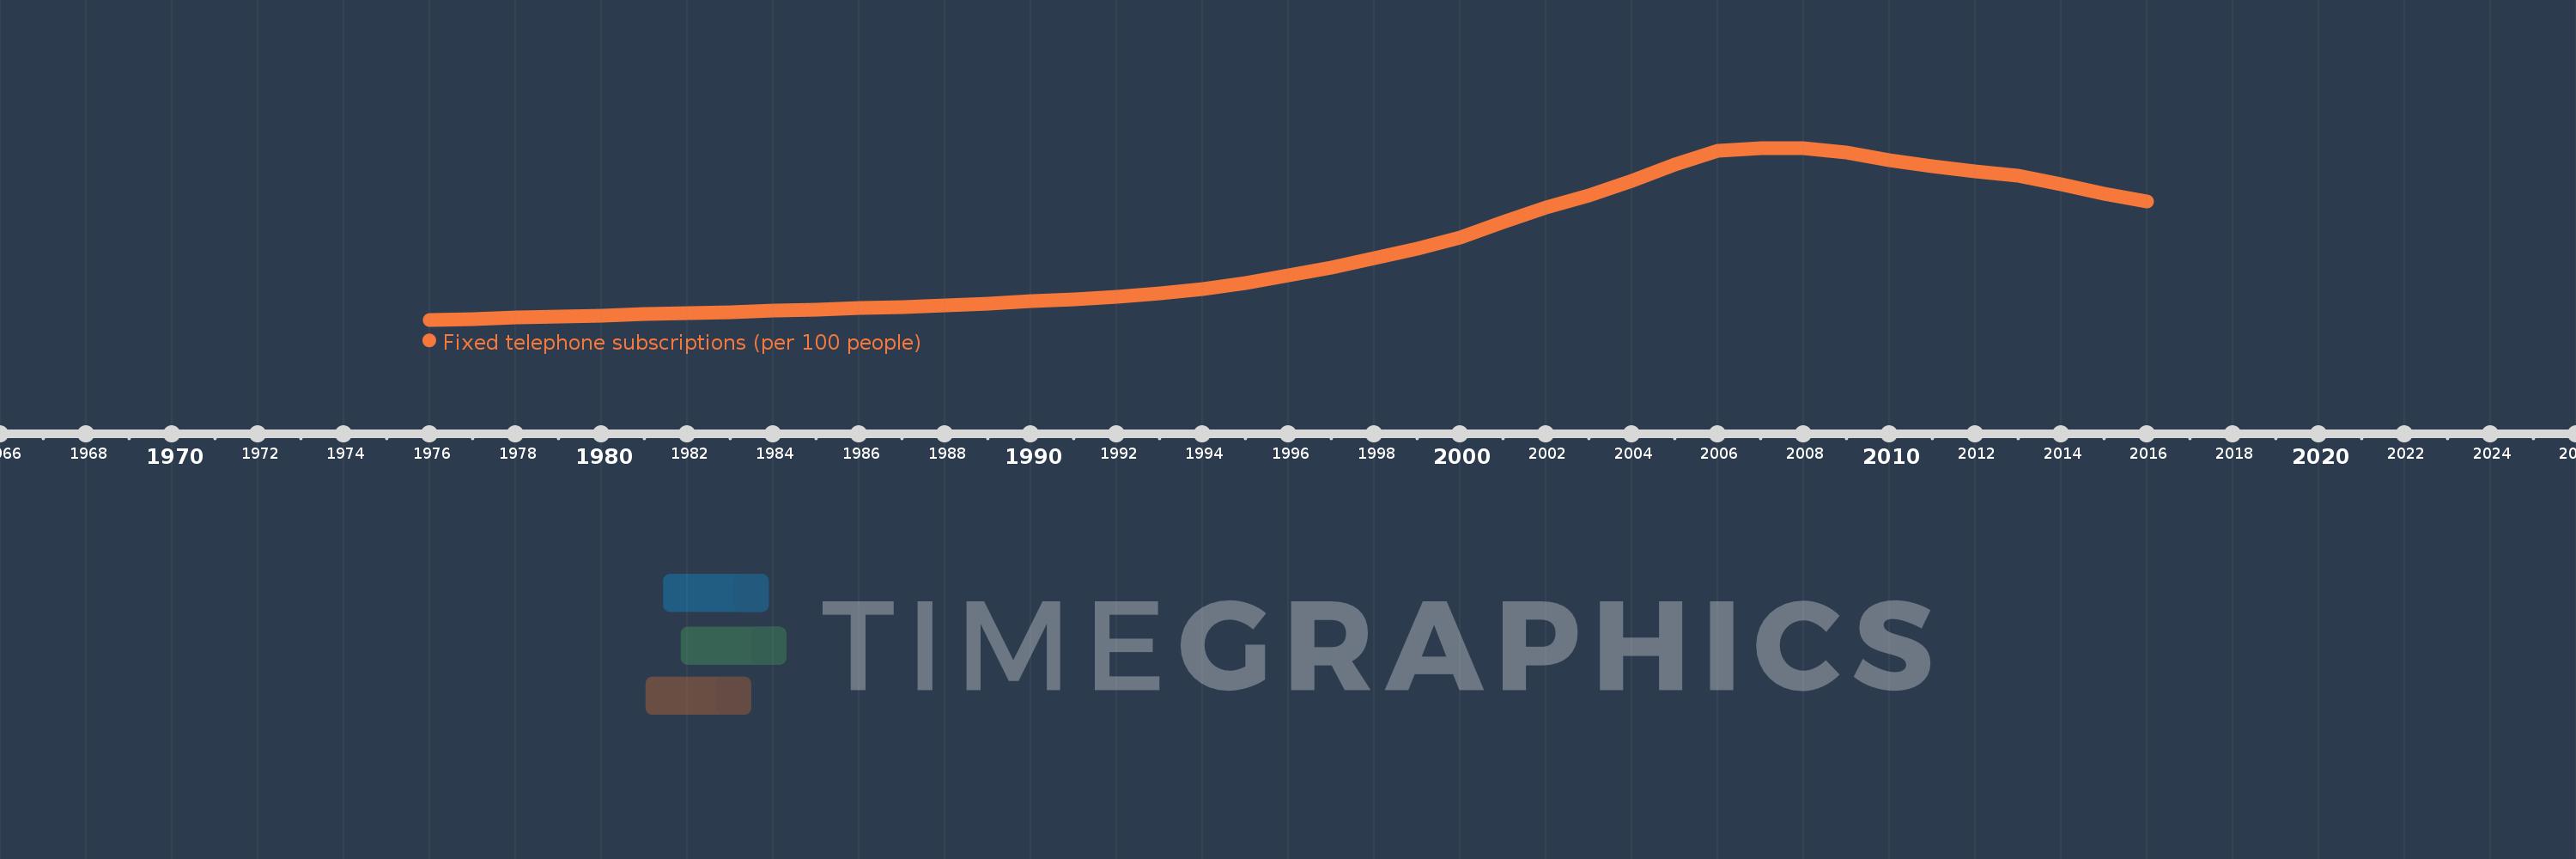
Fixed telephone subscriptions (per 100 people)
2016,2015,2014,2013,2012,2011,2010,2009,2008,2007,2006,2005,2004,2003,2002,2001,2000,1999,1998,1997,1996,1995,1994,1993,1992,1991,1990,1989,1988,1987,1986,1985,1984,1983,1982,1981,1980,1979,1978,1977,1976
This statistics in other country:
AfghanistanAlbaniaAlgeriaAmerican SamoaAndorraAngolaAntigua and BarbudaArab WorldArgentinaArmeniaArubaAustraliaAustriaAzerbaijanBahamas, TheBahrainBangladeshBarbadosBelarusBelgiumBelizeBeninBermudaBhutanBoliviaBosnia and HerzegovinaBotswanaBrazilBritish Virgin IslandsBrunei DarussalamBulgariaBurkina FasoBurundiCabo VerdeCambodiaCameroonCanadaCaribbean small statesCayman IslandsCentral African RepublicCentral Europe and the BalticsChadChileChinaColombiaComorosCongo, Dem. Rep.Congo, Rep.Costa RicaCote d'IvoireCroatiaCubaCuracaoCyprusCzech RepublicDenmarkDjiboutiDominicaDominican RepublicEarly-demographic dividendEast Asia & PacificEast Asia & Pacific (excluding high income)East Asia & Pacific (IDA & IBRD countries)EcuadorEgypt, Arab Rep.El SalvadorEquatorial GuineaEritreaEstoniaEthiopiaEuro areaEurope & Central AsiaEurope & Central Asia (excluding high income)Europe & Central Asia (IDA & IBRD countries)European UnionFaroe IslandsFijiFinlandFragile and conflict affected situationsFranceFrench PolynesiaGabonGambia, TheGeorgiaGermanyGhanaGibraltarGreeceGreenlandGrenadaGuamGuatemalaGuineaGuinea-BissauGuyanaHaitiHeavily indebted poor countries (HIPC)High incomeHondurasHong Kong SAR, ChinaHungaryIBRD onlyIcelandIDA & IBRD totalIDA blendIDA onlyIDA totalIndiaIndonesiaIran, Islamic Rep.IraqIrelandIsraelItalyJamaicaJapanJordanKazakhstanKenyaKiribatiKorea, Dem. People’s Rep.Korea, Rep.KosovoKuwaitKyrgyz RepublicLao PDRLate-demographic dividendLatin America & Caribbean Latin America & Caribbean (excluding high income)Latin America & the Caribbean (IDA & IBRD countries)LatviaLeast developed countries: UN classificationLebanonLesothoLiberiaLibyaLiechtensteinLithuaniaLow & middle incomeLow incomeLower middle incomeLuxembourgMacao SAR, ChinaMacedonia, FYRMadagascarMalawiMalaysiaMaldivesMaliMaltaMarshall IslandsMauritaniaMauritiusMexicoMicronesia, Fed. Sts.Middle East & North AfricaMiddle East & North Africa (excluding high income)Middle East & North Africa (IDA & IBRD countries)Middle incomeMoldovaMonacoMongoliaMontenegroMoroccoMozambiqueMyanmarNamibiaNauruNepalNetherlandsNew CaledoniaNew ZealandNicaraguaNigerNigeriaNorth AmericaNorthern Mariana IslandsNorwayOECD membersOmanOther small statesPacific island small statesPakistanPalauPanamaPapua New GuineaParaguayPeruPhilippinesPolandPortugalPost-demographic dividendPre-demographic dividendPuerto RicoQatarRomaniaRussian FederationRwandaSamoaSan MarinoSao Tome and PrincipeSaudi ArabiaSenegalSerbiaSeychellesSierra LeoneSingaporeSlovak RepublicSloveniaSmall statesSolomon IslandsSomaliaSouth AfricaSouth AsiaSouth Asia (IDA & IBRD)South SudanSpainSri LankaSt. Kitts and NevisSt. LuciaSt. Vincent and the GrenadinesSub-Saharan Africa Sub-Saharan Africa (excluding high income)Sub-Saharan Africa (IDA & IBRD countries)SudanSurinameSwazilandSwedenSwitzerlandSyrian Arab RepublicTajikistanTanzaniaThailandTimor-LesteTogoTongaTrinidad and TobagoTunisiaTurkeyTurkmenistanTurks and Caicos IslandsTuvaluUgandaUkraineUnited Arab EmiratesUnited KingdomUnited StatesUpper middle incomeUruguayUzbekistanVanuatuVenezuela, RBVietnamVirgin Islands (U.S.)West Bank and GazaWorldYemen, Rep.ZambiaZimbabwe Timeline:
This timeline shows a graph from 1976 to 2016 of IBRD only. No data until 1975. Number of actual observations by date: 41.
Source name:
World Development Indicators
Source organization:
International Telecommunication Union, World Telecommunication/ICT Development Report and database.
Categories, topics:
Infrastructure
Last updated:
apr 23, 2017
Indicators value changes by year
Maximum:
16.755
jan 1, 2008
At the date of observation
Value
Absolute change
Change from previous value
jan 1, 1976
1.117
+1.117
0.0%
jan 1, 1977
1.198
+0.082
7.3%
jan 1, 1978
1.307
+0.109
9.07%
jan 1, 1979
1.404
+0.097
7.4%
jan 1, 1980
1.521
+0.117
8.31%
jan 1, 1981
1.618
+0.098
6.43%
jan 1, 1982
1.729
+0.111
6.85%
jan 1, 1983
1.835
+0.106
6.14%
jan 1, 1984
1.934
+0.098
5.36%
jan 1, 1985
2.047
+0.113
5.84%
jan 1, 1986
2.174
+0.127
6.23%
jan 1, 1987
2.302
+0.128
5.91%
jan 1, 1988
2.439
+0.136
5.93%
jan 1, 1989
2.613
+0.174
7.14%
jan 1, 1990
2.781
+0.168
6.44%
jan 1, 1991
2.982
+0.201
7.22%
jan 1, 1992
3.222
+0.24
8.05%
jan 1, 1993
3.528
+0.305
9.48%
jan 1, 1994
3.931
+0.403
11.42%
jan 1, 1995
4.489
+0.559
14.21%
jan 1, 1996
5.148
+0.659
14.67%
jan 1, 1997
5.891
+0.743
14.43%
jan 1, 1998
6.718
+0.827
14.04%
jan 1, 1999
7.553
+0.835
12.43%
jan 1, 2000
8.575
+1.022
13.53%
jan 1, 2001
9.979
+1.404
16.38%
jan 1, 2002
11.351
+1.372
13.75%
jan 1, 2003
12.441
+1.09
9.6%
jan 1, 2004
13.766
+1.326
10.66%
jan 1, 2005
15.281
+1.515
11.0%
jan 1, 2006
16.47
+1.189
7.78%
jan 1, 2007
16.722
+0.251
1.53%
jan 1, 2008
16.755
+0.034
0.2%
jan 1, 2009
16.366
-0.389
-2.32%
jan 1, 2010
15.633
-0.733
-4.48%
jan 1, 2011
15.086
-0.547
-3.5%
jan 1, 2012
14.62
-0.467
-3.09%
jan 1, 2013
14.206
-0.414
-2.83%
jan 1, 2014
13.483
-0.723
-5.09%
jan 1, 2015
12.609
-0.874
-6.48%
jan 1, 2016
11.872
-0.737
-5.84%
Ranking of countries by current statistics by years


Comments: