29
/
en
AIzaSyAYiBZKx7MnpbEhh9jyipgxe19OcubqV5w
April 1, 2024
251870
St. Vincent and the Grenadines
VCT
true
2
1
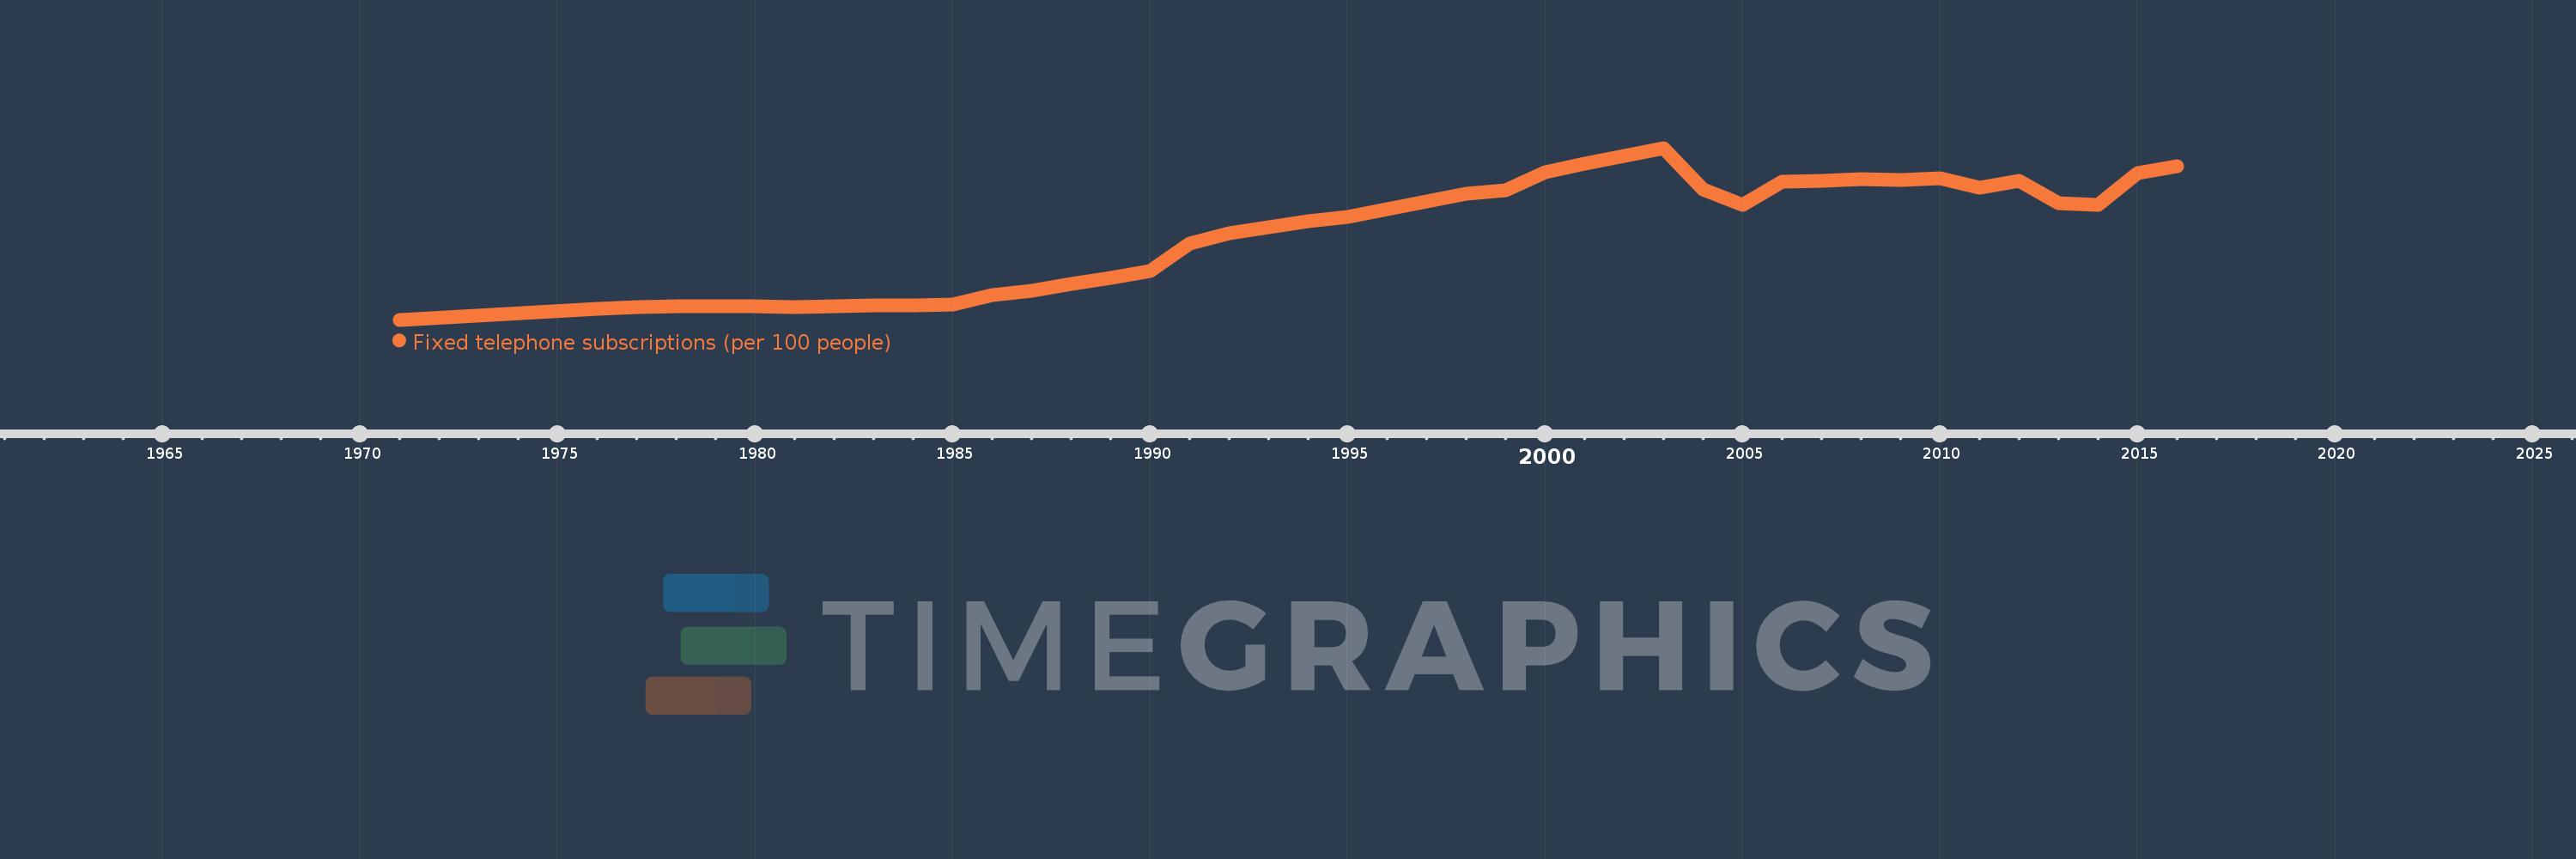
Fixed telephone subscriptions (per 100 people)
2016,2015,2014,2013,2012,2011,2010,2009,2008,2007,2006,2005,2004,2003,2002,2001,2000,1999,1998,1997,1996,1995,1994,1993,1992,1991,1990,1989,1988,1987,1986,1985,1984,1983,1982,1981,1980,1979,1978,1977,1976,1971
This statistics in other country:
AfghanistanAlbaniaAlgeriaAmerican SamoaAndorraAngolaAntigua and BarbudaArab WorldArgentinaArmeniaArubaAustraliaAustriaAzerbaijanBahamas, TheBahrainBangladeshBarbadosBelarusBelgiumBelizeBeninBermudaBhutanBoliviaBosnia and HerzegovinaBotswanaBrazilBritish Virgin IslandsBrunei DarussalamBulgariaBurkina FasoBurundiCabo VerdeCambodiaCameroonCanadaCaribbean small statesCayman IslandsCentral African RepublicCentral Europe and the BalticsChadChileChinaColombiaComorosCongo, Dem. Rep.Congo, Rep.Costa RicaCote d'IvoireCroatiaCubaCuracaoCyprusCzech RepublicDenmarkDjiboutiDominicaDominican RepublicEarly-demographic dividendEast Asia & PacificEast Asia & Pacific (excluding high income)East Asia & Pacific (IDA & IBRD countries)EcuadorEgypt, Arab Rep.El SalvadorEquatorial GuineaEritreaEstoniaEthiopiaEuro areaEurope & Central AsiaEurope & Central Asia (excluding high income)Europe & Central Asia (IDA & IBRD countries)European UnionFaroe IslandsFijiFinlandFragile and conflict affected situationsFranceFrench PolynesiaGabonGambia, TheGeorgiaGermanyGhanaGibraltarGreeceGreenlandGrenadaGuamGuatemalaGuineaGuinea-BissauGuyanaHaitiHeavily indebted poor countries (HIPC)High incomeHondurasHong Kong SAR, ChinaHungaryIBRD onlyIcelandIDA & IBRD totalIDA blendIDA onlyIDA totalIndiaIndonesiaIran, Islamic Rep.IraqIrelandIsraelItalyJamaicaJapanJordanKazakhstanKenyaKiribatiKorea, Dem. People’s Rep.Korea, Rep.KosovoKuwaitKyrgyz RepublicLao PDRLate-demographic dividendLatin America & Caribbean Latin America & Caribbean (excluding high income)Latin America & the Caribbean (IDA & IBRD countries)LatviaLeast developed countries: UN classificationLebanonLesothoLiberiaLibyaLiechtensteinLithuaniaLow & middle incomeLow incomeLower middle incomeLuxembourgMacao SAR, ChinaMacedonia, FYRMadagascarMalawiMalaysiaMaldivesMaliMaltaMarshall IslandsMauritaniaMauritiusMexicoMicronesia, Fed. Sts.Middle East & North AfricaMiddle East & North Africa (excluding high income)Middle East & North Africa (IDA & IBRD countries)Middle incomeMoldovaMonacoMongoliaMontenegroMoroccoMozambiqueMyanmarNamibiaNauruNepalNetherlandsNew CaledoniaNew ZealandNicaraguaNigerNigeriaNorth AmericaNorthern Mariana IslandsNorwayOECD membersOmanOther small statesPacific island small statesPakistanPalauPanamaPapua New GuineaParaguayPeruPhilippinesPolandPortugalPost-demographic dividendPre-demographic dividendPuerto RicoQatarRomaniaRussian FederationRwandaSamoaSan MarinoSao Tome and PrincipeSaudi ArabiaSenegalSerbiaSeychellesSierra LeoneSingaporeSlovak RepublicSloveniaSmall statesSolomon IslandsSomaliaSouth AfricaSouth AsiaSouth Asia (IDA & IBRD)South SudanSpainSri LankaSt. Kitts and NevisSt. LuciaSt. Vincent and the GrenadinesSub-Saharan Africa Sub-Saharan Africa (excluding high income)Sub-Saharan Africa (IDA & IBRD countries)SudanSurinameSwazilandSwedenSwitzerlandSyrian Arab RepublicTajikistanTanzaniaThailandTimor-LesteTogoTongaTrinidad and TobagoTunisiaTurkeyTurkmenistanTurks and Caicos IslandsTuvaluUgandaUkraineUnited Arab EmiratesUnited KingdomUnited StatesUpper middle incomeUruguayUzbekistanVanuatuVenezuela, RBVietnamVirgin Islands (U.S.)West Bank and GazaWorldYemen, Rep.ZambiaZimbabwe Timeline:
This timeline shows a graph from 1971 to 2016 of St. Vincent and the Grenadines. No data until 1970. Number of actual observations by date: 42.
Source name:
World Development Indicators
Source organization:
International Telecommunication Union, World Telecommunication/ICT Development Report and database.
Categories, topics:
Infrastructure
Last updated:
apr 23, 2017
Indicators value changes by year
Maximum:
25.264
jan 1, 2003
At the date of observation
Value
Absolute change
Change from previous value
jan 1, 1971
1.769
+1.769
0.0%
jan 1, 1976
3.315
+1.547
87.44%
jan 1, 1977
3.446
+0.13
3.93%
jan 1, 1978
3.564
+0.118
3.42%
jan 1, 1979
3.599
+0.035
0.99%
jan 1, 1980
3.565
-0.035
-0.96%
jan 1, 1981
3.532
-0.033
-0.91%
jan 1, 1982
3.67
+0.138
3.92%
jan 1, 1983
3.726
+0.056
1.51%
jan 1, 1984
3.787
+0.061
1.64%
jan 1, 1985
3.799
+0.012
0.31%
jan 1, 1986
5.187
+1.388
36.54%
jan 1, 1987
5.704
+0.517
9.96%
jan 1, 1988
6.611
+0.907
15.9%
jan 1, 1989
7.509
+0.899
13.6%
jan 1, 1990
8.427
+0.918
12.22%
jan 1, 1991
12.202
+3.775
44.79%
jan 1, 1992
13.572
+1.37
11.23%
jan 1, 1993
14.45
+0.878
6.47%
jan 1, 1994
15.242
+0.792
5.48%
jan 1, 1995
15.885
+0.643
4.22%
jan 1, 1996
16.866
+0.981
6.18%
jan 1, 1997
17.905
+1.039
6.16%
jan 1, 1998
18.979
+1.075
6.0%
jan 1, 1999
19.5
+0.521
2.74%
jan 1, 2000
21.905
+2.405
12.33%
jan 1, 2001
23.083
+1.178
5.38%
jan 1, 2002
24.149
+1.066
4.62%
jan 1, 2003
25.264
+1.115
4.62%
jan 1, 2004
19.556
-5.708
-22.59%
jan 1, 2005
17.522
-2.035
-10.4%
jan 1, 2006
20.694
+3.173
18.11%
jan 1, 2007
20.788
+0.094
0.45%
jan 1, 2008
21.025
+0.237
1.14%
jan 1, 2009
20.866
-0.159
-0.76%
jan 1, 2010
21.07
+0.204
0.98%
jan 1, 2011
19.853
-1.217
-5.77%
jan 1, 2012
20.779
+0.925
4.66%
jan 1, 2013
17.718
-3.06
-14.73%
jan 1, 2014
17.435
-0.283
-1.6%
jan 1, 2015
21.855
+4.42
25.35%
jan 1, 2016
22.734
+0.879
4.02%
Ranking of countries by current statistics by years


Comments: