29
/
en
AIzaSyAYiBZKx7MnpbEhh9jyipgxe19OcubqV5w
April 1, 2024
266816
Trinidad and Tobago
TTO
true
2
1
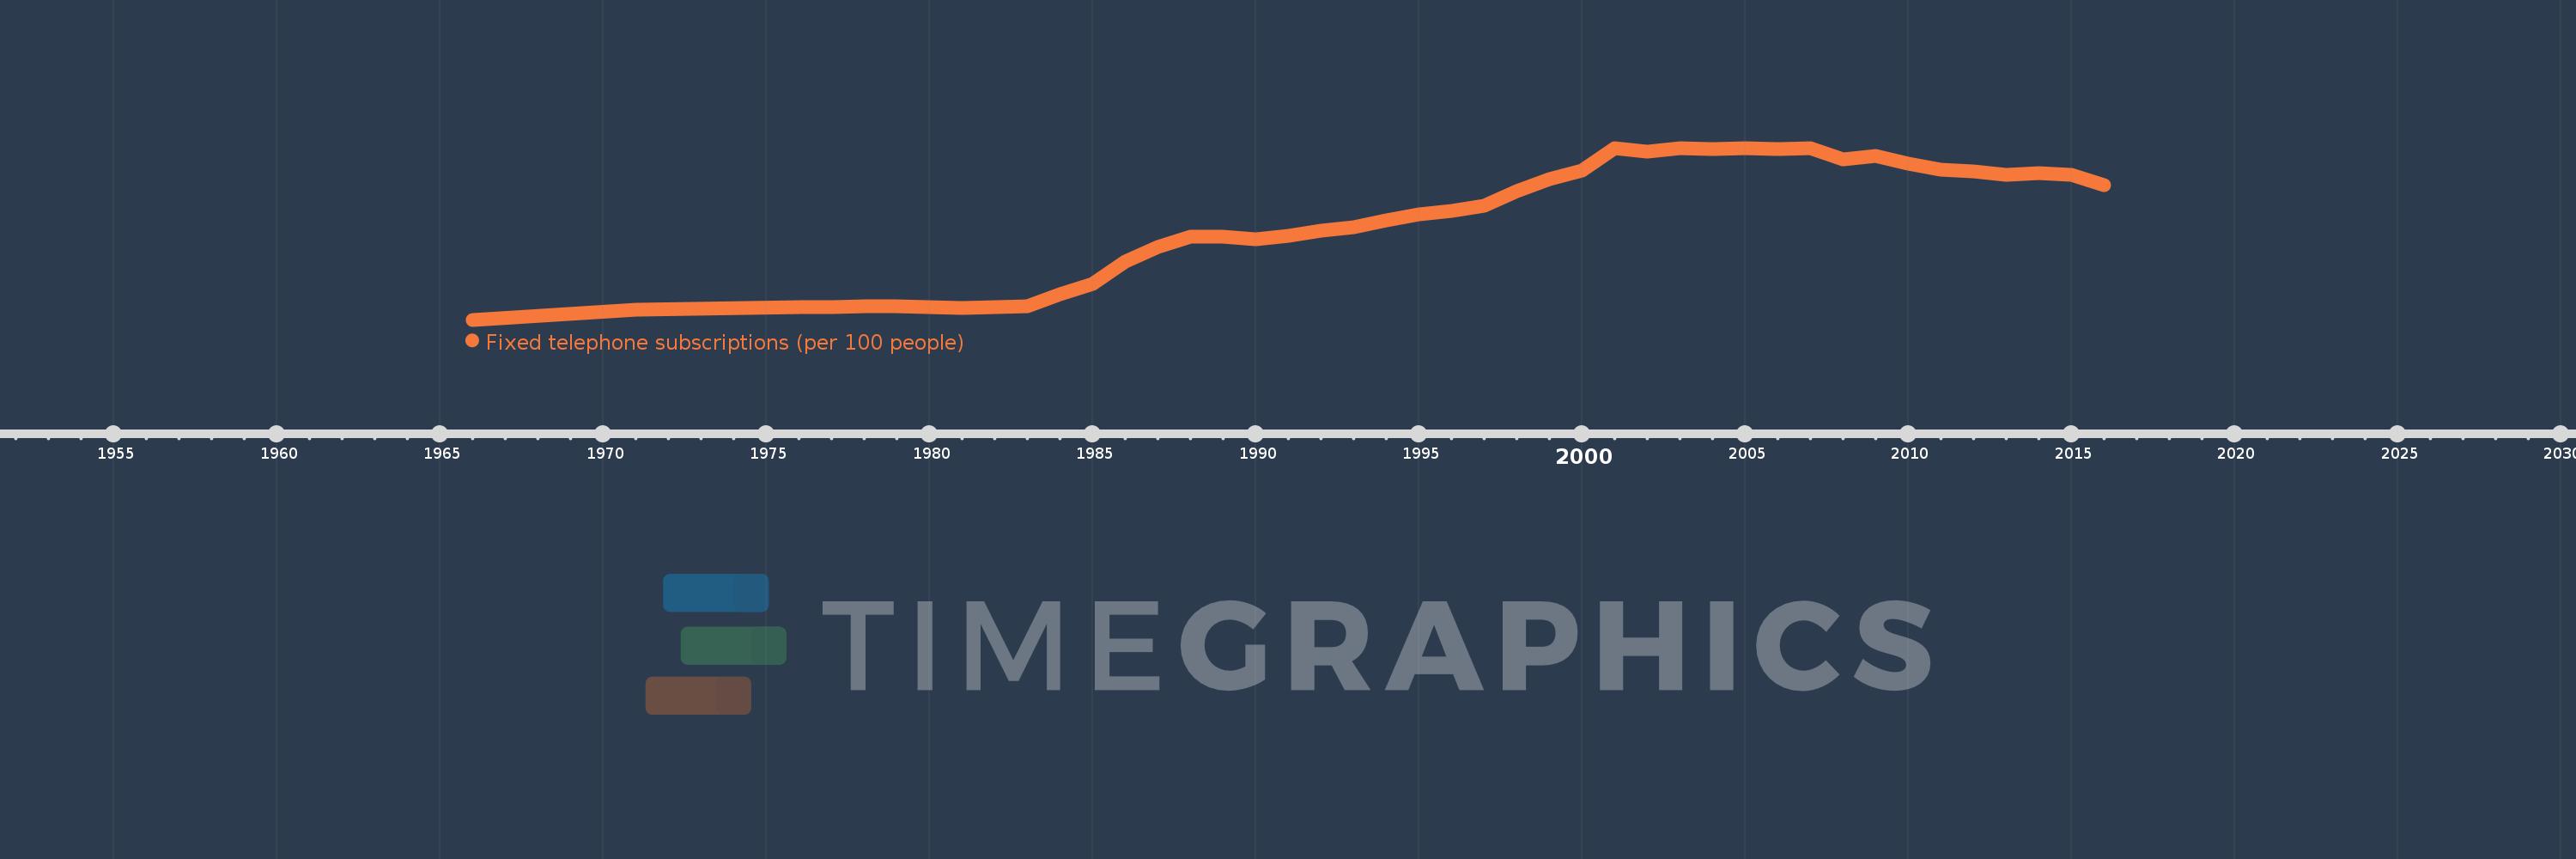
Fixed telephone subscriptions (per 100 people)
2016,2015,2014,2013,2012,2011,2010,2009,2008,2007,2006,2005,2004,2003,2002,2001,2000,1999,1998,1997,1996,1995,1994,1993,1992,1991,1990,1989,1988,1987,1986,1985,1984,1983,1982,1981,1980,1979,1978,1977,1976,1971,1966
This statistics in other country:
AfghanistanAlbaniaAlgeriaAmerican SamoaAndorraAngolaAntigua and BarbudaArab WorldArgentinaArmeniaArubaAustraliaAustriaAzerbaijanBahamas, TheBahrainBangladeshBarbadosBelarusBelgiumBelizeBeninBermudaBhutanBoliviaBosnia and HerzegovinaBotswanaBrazilBritish Virgin IslandsBrunei DarussalamBulgariaBurkina FasoBurundiCabo VerdeCambodiaCameroonCanadaCaribbean small statesCayman IslandsCentral African RepublicCentral Europe and the BalticsChadChileChinaColombiaComorosCongo, Dem. Rep.Congo, Rep.Costa RicaCote d'IvoireCroatiaCubaCuracaoCyprusCzech RepublicDenmarkDjiboutiDominicaDominican RepublicEarly-demographic dividendEast Asia & PacificEast Asia & Pacific (excluding high income)East Asia & Pacific (IDA & IBRD countries)EcuadorEgypt, Arab Rep.El SalvadorEquatorial GuineaEritreaEstoniaEthiopiaEuro areaEurope & Central AsiaEurope & Central Asia (excluding high income)Europe & Central Asia (IDA & IBRD countries)European UnionFaroe IslandsFijiFinlandFragile and conflict affected situationsFranceFrench PolynesiaGabonGambia, TheGeorgiaGermanyGhanaGibraltarGreeceGreenlandGrenadaGuamGuatemalaGuineaGuinea-BissauGuyanaHaitiHeavily indebted poor countries (HIPC)High incomeHondurasHong Kong SAR, ChinaHungaryIBRD onlyIcelandIDA & IBRD totalIDA blendIDA onlyIDA totalIndiaIndonesiaIran, Islamic Rep.IraqIrelandIsraelItalyJamaicaJapanJordanKazakhstanKenyaKiribatiKorea, Dem. People’s Rep.Korea, Rep.KosovoKuwaitKyrgyz RepublicLao PDRLate-demographic dividendLatin America & Caribbean Latin America & Caribbean (excluding high income)Latin America & the Caribbean (IDA & IBRD countries)LatviaLeast developed countries: UN classificationLebanonLesothoLiberiaLibyaLiechtensteinLithuaniaLow & middle incomeLow incomeLower middle incomeLuxembourgMacao SAR, ChinaMacedonia, FYRMadagascarMalawiMalaysiaMaldivesMaliMaltaMarshall IslandsMauritaniaMauritiusMexicoMicronesia, Fed. Sts.Middle East & North AfricaMiddle East & North Africa (excluding high income)Middle East & North Africa (IDA & IBRD countries)Middle incomeMoldovaMonacoMongoliaMontenegroMoroccoMozambiqueMyanmarNamibiaNauruNepalNetherlandsNew CaledoniaNew ZealandNicaraguaNigerNigeriaNorth AmericaNorthern Mariana IslandsNorwayOECD membersOmanOther small statesPacific island small statesPakistanPalauPanamaPapua New GuineaParaguayPeruPhilippinesPolandPortugalPost-demographic dividendPre-demographic dividendPuerto RicoQatarRomaniaRussian FederationRwandaSamoaSan MarinoSao Tome and PrincipeSaudi ArabiaSenegalSerbiaSeychellesSierra LeoneSingaporeSlovak RepublicSloveniaSmall statesSolomon IslandsSomaliaSouth AfricaSouth AsiaSouth Asia (IDA & IBRD)South SudanSpainSri LankaSt. Kitts and NevisSt. LuciaSt. Vincent and the GrenadinesSub-Saharan Africa Sub-Saharan Africa (excluding high income)Sub-Saharan Africa (IDA & IBRD countries)SudanSurinameSwazilandSwedenSwitzerlandSyrian Arab RepublicTajikistanTanzaniaThailandTimor-LesteTogoTongaTrinidad and TobagoTunisiaTurkeyTurkmenistanTurks and Caicos IslandsTuvaluUgandaUkraineUnited Arab EmiratesUnited KingdomUnited StatesUpper middle incomeUruguayUzbekistanVanuatuVenezuela, RBVietnamVirgin Islands (U.S.)West Bank and GazaWorldYemen, Rep.ZambiaZimbabwe Timeline:
This timeline shows a graph from 1966 to 2016 of Trinidad and Tobago. No data until 1965. Number of actual observations by date: 43.
Source name:
World Development Indicators
Source organization:
International Telecommunication Union, World Telecommunication/ICT Development Report and database.
Categories, topics:
Infrastructure
Last updated:
apr 23, 2017
Indicators value changes by year
Maximum:
24.982
jan 1, 2001
At the date of observation
Value
Absolute change
Change from previous value
jan 1, 1966
2.433
+2.433
0.0%
jan 1, 1971
3.71
+1.277
52.5%
jan 1, 1976
4.034
+0.323
8.71%
jan 1, 1977
4.114
+0.081
2.0%
jan 1, 1978
4.168
+0.053
1.29%
jan 1, 1979
4.175
+0.007
0.17%
jan 1, 1980
4.096
-0.079
-1.89%
jan 1, 1981
3.978
-0.118
-2.88%
jan 1, 1982
4.095
+0.117
2.94%
jan 1, 1983
4.174
+0.079
1.93%
jan 1, 1984
5.825
+1.65
39.53%
jan 1, 1985
7.159
+1.334
22.9%
jan 1, 1986
10.084
+2.925
40.86%
jan 1, 1987
11.977
+1.894
18.78%
jan 1, 1988
13.29
+1.313
10.96%
jan 1, 1989
13.371
+0.081
0.61%
jan 1, 1990
13.036
-0.335
-2.51%
jan 1, 1991
13.498
+0.462
3.54%
jan 1, 1992
14.145
+0.647
4.79%
jan 1, 1993
14.554
+0.41
2.9%
jan 1, 1994
15.468
+0.914
6.28%
jan 1, 1995
16.301
+0.833
5.39%
jan 1, 1996
16.678
+0.377
2.31%
jan 1, 1997
17.447
+0.769
4.61%
jan 1, 1998
19.306
+1.859
10.65%
jan 1, 1999
20.916
+1.609
8.34%
jan 1, 2000
22.049
+1.134
5.42%
jan 1, 2001
24.982
+2.933
13.3%
jan 1, 2002
24.509
-0.473
-1.89%
jan 1, 2003
24.903
+0.394
1.61%
jan 1, 2004
24.837
-0.065
-0.26%
jan 1, 2005
24.98
+0.143
0.57%
jan 1, 2006
24.851
-0.129
-0.52%
jan 1, 2007
24.972
+0.121
0.49%
jan 1, 2008
23.457
-1.514
-6.06%
jan 1, 2009
23.912
+0.455
1.94%
jan 1, 2010
22.928
-0.984
-4.12%
jan 1, 2011
22.085
-0.843
-3.68%
jan 1, 2012
21.907
-0.179
-0.81%
jan 1, 2013
21.429
-0.477
-2.18%
jan 1, 2014
21.719
+0.29
1.35%
jan 1, 2015
21.493
-0.226
-1.04%
jan 1, 2016
20.114
-1.38
-6.42%
Ranking of countries by current statistics by years


Comments: