29
/
en
AIzaSyAYiBZKx7MnpbEhh9jyipgxe19OcubqV5w
April 1, 2024
214285
Norway
NOR
true
2
1
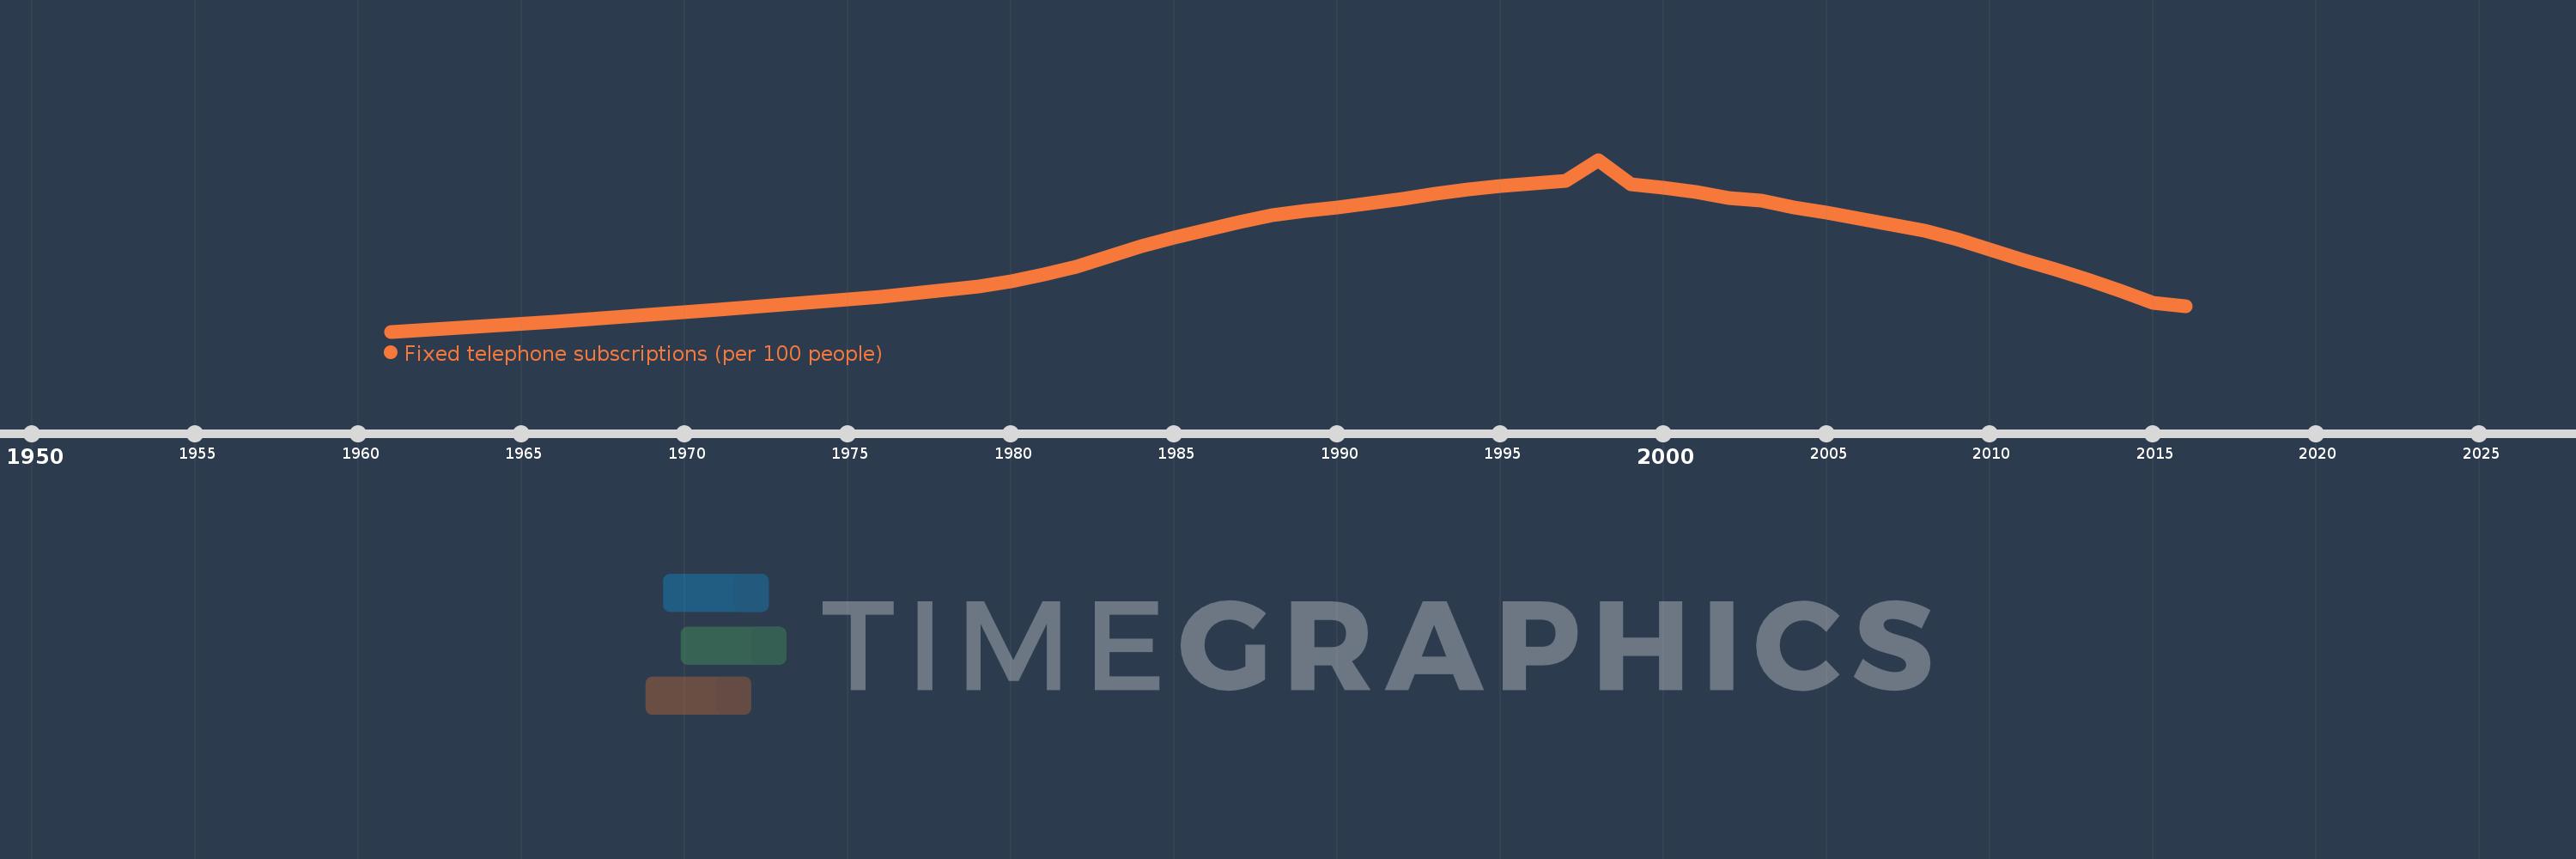
Fixed telephone subscriptions (per 100 people)
2016,2015,2014,2013,2012,2011,2010,2009,2008,2007,2006,2005,2004,2003,2002,2001,2000,1999,1998,1997,1996,1995,1994,1993,1992,1991,1990,1989,1988,1987,1986,1985,1984,1983,1982,1981,1980,1979,1978,1977,1976,1971,1966,1961
This statistics in other country:
AfghanistanAlbaniaAlgeriaAmerican SamoaAndorraAngolaAntigua and BarbudaArab WorldArgentinaArmeniaArubaAustraliaAustriaAzerbaijanBahamas, TheBahrainBangladeshBarbadosBelarusBelgiumBelizeBeninBermudaBhutanBoliviaBosnia and HerzegovinaBotswanaBrazilBritish Virgin IslandsBrunei DarussalamBulgariaBurkina FasoBurundiCabo VerdeCambodiaCameroonCanadaCaribbean small statesCayman IslandsCentral African RepublicCentral Europe and the BalticsChadChileChinaColombiaComorosCongo, Dem. Rep.Congo, Rep.Costa RicaCote d'IvoireCroatiaCubaCuracaoCyprusCzech RepublicDenmarkDjiboutiDominicaDominican RepublicEarly-demographic dividendEast Asia & PacificEast Asia & Pacific (excluding high income)East Asia & Pacific (IDA & IBRD countries)EcuadorEgypt, Arab Rep.El SalvadorEquatorial GuineaEritreaEstoniaEthiopiaEuro areaEurope & Central AsiaEurope & Central Asia (excluding high income)Europe & Central Asia (IDA & IBRD countries)European UnionFaroe IslandsFijiFinlandFragile and conflict affected situationsFranceFrench PolynesiaGabonGambia, TheGeorgiaGermanyGhanaGibraltarGreeceGreenlandGrenadaGuamGuatemalaGuineaGuinea-BissauGuyanaHaitiHeavily indebted poor countries (HIPC)High incomeHondurasHong Kong SAR, ChinaHungaryIBRD onlyIcelandIDA & IBRD totalIDA blendIDA onlyIDA totalIndiaIndonesiaIran, Islamic Rep.IraqIrelandIsraelItalyJamaicaJapanJordanKazakhstanKenyaKiribatiKorea, Dem. People’s Rep.Korea, Rep.KosovoKuwaitKyrgyz RepublicLao PDRLate-demographic dividendLatin America & Caribbean Latin America & Caribbean (excluding high income)Latin America & the Caribbean (IDA & IBRD countries)LatviaLeast developed countries: UN classificationLebanonLesothoLiberiaLibyaLiechtensteinLithuaniaLow & middle incomeLow incomeLower middle incomeLuxembourgMacao SAR, ChinaMacedonia, FYRMadagascarMalawiMalaysiaMaldivesMaliMaltaMarshall IslandsMauritaniaMauritiusMexicoMicronesia, Fed. Sts.Middle East & North AfricaMiddle East & North Africa (excluding high income)Middle East & North Africa (IDA & IBRD countries)Middle incomeMoldovaMonacoMongoliaMontenegroMoroccoMozambiqueMyanmarNamibiaNauruNepalNetherlandsNew CaledoniaNew ZealandNicaraguaNigerNigeriaNorth AmericaNorthern Mariana IslandsNorwayOECD membersOmanOther small statesPacific island small statesPakistanPalauPanamaPapua New GuineaParaguayPeruPhilippinesPolandPortugalPost-demographic dividendPre-demographic dividendPuerto RicoQatarRomaniaRussian FederationRwandaSamoaSan MarinoSao Tome and PrincipeSaudi ArabiaSenegalSerbiaSeychellesSierra LeoneSingaporeSlovak RepublicSloveniaSmall statesSolomon IslandsSomaliaSouth AfricaSouth AsiaSouth Asia (IDA & IBRD)South SudanSpainSri LankaSt. Kitts and NevisSt. LuciaSt. Vincent and the GrenadinesSub-Saharan Africa Sub-Saharan Africa (excluding high income)Sub-Saharan Africa (IDA & IBRD countries)SudanSurinameSwazilandSwedenSwitzerlandSyrian Arab RepublicTajikistanTanzaniaThailandTimor-LesteTogoTongaTrinidad and TobagoTunisiaTurkeyTurkmenistanTurks and Caicos IslandsTuvaluUgandaUkraineUnited Arab EmiratesUnited KingdomUnited StatesUpper middle incomeUruguayUzbekistanVanuatuVenezuela, RBVietnamVirgin Islands (U.S.)West Bank and GazaWorldYemen, Rep.ZambiaZimbabwe Timeline:
This timeline shows a graph from 1961 to 2016 of Norway. No data until 1960. Number of actual observations by date: 44.
Source name:
World Development Indicators
Source organization:
International Telecommunication Union, World Telecommunication/ICT Development Report and database.
Categories, topics:
Infrastructure
Last updated:
apr 23, 2017
Indicators value changes by year
Maximum:
62.883
jan 1, 1998
At the date of observation
Value
Absolute change
Change from previous value
jan 1, 1961
12.7
+12.7
0.0%
jan 1, 1966
15.644
+2.945
23.19%
jan 1, 1971
19.153
+3.508
22.43%
jan 1, 1976
22.812
+3.659
19.11%
jan 1, 1977
23.747
+0.935
4.1%
jan 1, 1978
24.853
+1.106
4.66%
jan 1, 1979
25.994
+1.141
4.59%
jan 1, 1980
27.378
+1.384
5.32%
jan 1, 1981
29.327
+1.949
7.12%
jan 1, 1982
31.687
+2.36
8.05%
jan 1, 1983
34.704
+3.016
9.52%
jan 1, 1984
37.72
+3.016
8.69%
jan 1, 1985
40.094
+2.374
6.29%
jan 1, 1986
42.37
+2.276
5.68%
jan 1, 1987
44.701
+2.331
5.5%
jan 1, 1988
46.604
+1.904
4.26%
jan 1, 1989
48.007
+1.403
3.01%
jan 1, 1990
49.063
+1.056
2.2%
jan 1, 1991
50.285
+1.222
2.49%
jan 1, 1992
51.573
+1.288
2.56%
jan 1, 1993
52.934
+1.361
2.64%
jan 1, 1994
54.177
+1.244
2.35%
jan 1, 1995
55.232
+1.055
1.95%
jan 1, 1996
56.058
+0.826
1.49%
jan 1, 1997
56.635
+0.578
1.03%
jan 1, 1998
62.883
+6.248
11.03%
jan 1, 1999
55.742
-7.141
-11.36%
jan 1, 2000
54.764
-0.978
-1.75%
jan 1, 2001
53.456
-1.308
-2.39%
jan 1, 2002
51.783
-1.673
-3.13%
jan 1, 2003
51.071
-0.712
-1.37%
jan 1, 2004
49.037
-2.034
-3.98%
jan 1, 2005
47.52
-1.517
-3.09%
jan 1, 2006
45.598
-1.922
-4.04%
jan 1, 2007
44.015
-1.583
-3.47%
jan 1, 2008
42.113
-1.903
-4.32%
jan 1, 2009
39.756
-2.357
-5.6%
jan 1, 2010
36.622
-3.134
-7.88%
jan 1, 2011
33.681
-2.942
-8.03%
jan 1, 2012
30.791
-2.89
-8.58%
jan 1, 2013
27.955
-2.836
-9.21%
jan 1, 2014
24.525
-3.43
-12.27%
jan 1, 2015
21.227
-3.298
-13.45%
jan 1, 2016
20.019
-1.208
-5.69%
Ranking of countries by current statistics by years


Comments: