29
/
en
AIzaSyAYiBZKx7MnpbEhh9jyipgxe19OcubqV5w
April 1, 2024
116863
Cyprus
CYP
true
2
1
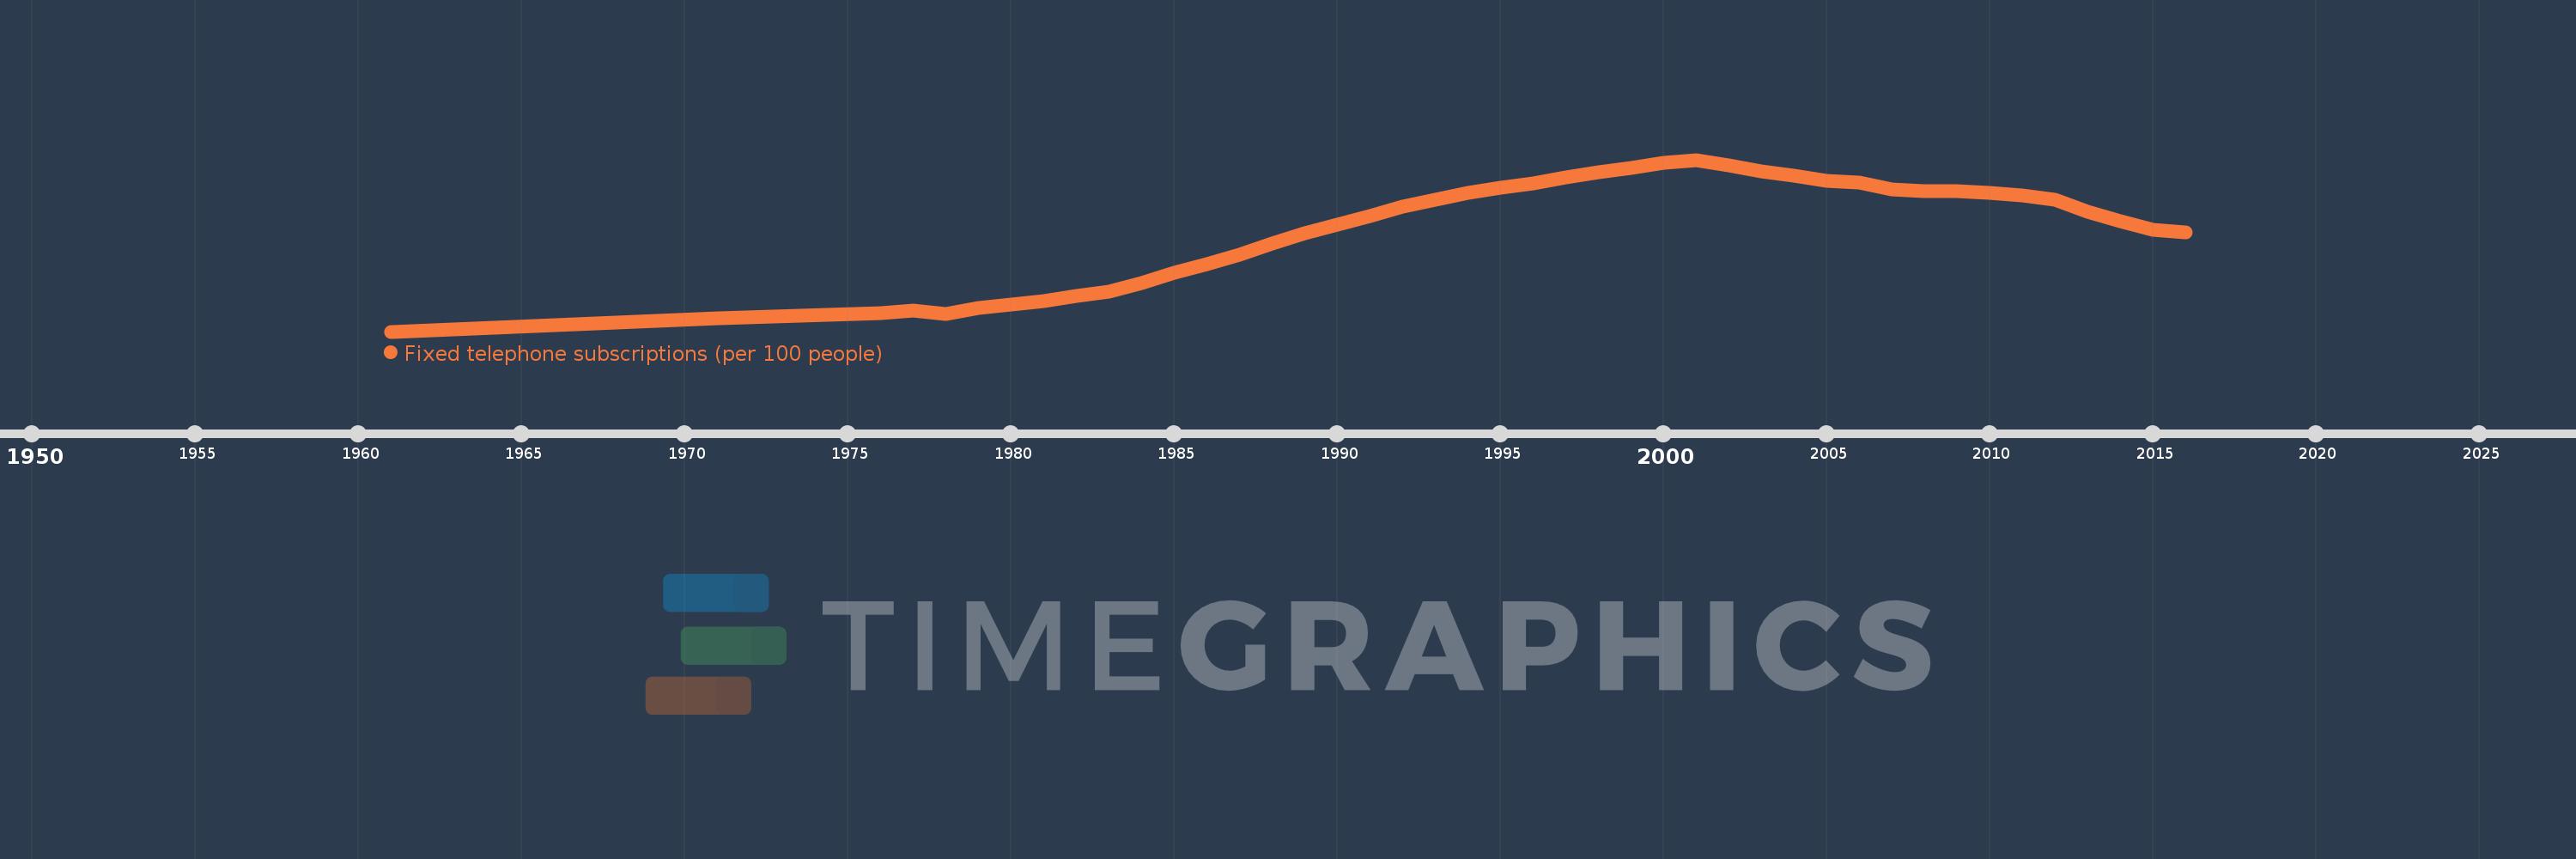
Fixed telephone subscriptions (per 100 people)
2016,2015,2014,2013,2012,2011,2010,2009,2008,2007,2006,2005,2004,2003,2002,2001,2000,1999,1998,1997,1996,1995,1994,1993,1992,1991,1990,1989,1988,1987,1986,1985,1984,1983,1982,1981,1980,1979,1978,1977,1976,1971,1966,1961
This statistics in other country:
AfghanistanAlbaniaAlgeriaAmerican SamoaAndorraAngolaAntigua and BarbudaArab WorldArgentinaArmeniaArubaAustraliaAustriaAzerbaijanBahamas, TheBahrainBangladeshBarbadosBelarusBelgiumBelizeBeninBermudaBhutanBoliviaBosnia and HerzegovinaBotswanaBrazilBritish Virgin IslandsBrunei DarussalamBulgariaBurkina FasoBurundiCabo VerdeCambodiaCameroonCanadaCaribbean small statesCayman IslandsCentral African RepublicCentral Europe and the BalticsChadChileChinaColombiaComorosCongo, Dem. Rep.Congo, Rep.Costa RicaCote d'IvoireCroatiaCubaCuracaoCyprusCzech RepublicDenmarkDjiboutiDominicaDominican RepublicEarly-demographic dividendEast Asia & PacificEast Asia & Pacific (excluding high income)East Asia & Pacific (IDA & IBRD countries)EcuadorEgypt, Arab Rep.El SalvadorEquatorial GuineaEritreaEstoniaEthiopiaEuro areaEurope & Central AsiaEurope & Central Asia (excluding high income)Europe & Central Asia (IDA & IBRD countries)European UnionFaroe IslandsFijiFinlandFragile and conflict affected situationsFranceFrench PolynesiaGabonGambia, TheGeorgiaGermanyGhanaGibraltarGreeceGreenlandGrenadaGuamGuatemalaGuineaGuinea-BissauGuyanaHaitiHeavily indebted poor countries (HIPC)High incomeHondurasHong Kong SAR, ChinaHungaryIBRD onlyIcelandIDA & IBRD totalIDA blendIDA onlyIDA totalIndiaIndonesiaIran, Islamic Rep.IraqIrelandIsraelItalyJamaicaJapanJordanKazakhstanKenyaKiribatiKorea, Dem. People’s Rep.Korea, Rep.KosovoKuwaitKyrgyz RepublicLao PDRLate-demographic dividendLatin America & Caribbean Latin America & Caribbean (excluding high income)Latin America & the Caribbean (IDA & IBRD countries)LatviaLeast developed countries: UN classificationLebanonLesothoLiberiaLibyaLiechtensteinLithuaniaLow & middle incomeLow incomeLower middle incomeLuxembourgMacao SAR, ChinaMacedonia, FYRMadagascarMalawiMalaysiaMaldivesMaliMaltaMarshall IslandsMauritaniaMauritiusMexicoMicronesia, Fed. Sts.Middle East & North AfricaMiddle East & North Africa (excluding high income)Middle East & North Africa (IDA & IBRD countries)Middle incomeMoldovaMonacoMongoliaMontenegroMoroccoMozambiqueMyanmarNamibiaNauruNepalNetherlandsNew CaledoniaNew ZealandNicaraguaNigerNigeriaNorth AmericaNorthern Mariana IslandsNorwayOECD membersOmanOther small statesPacific island small statesPakistanPalauPanamaPapua New GuineaParaguayPeruPhilippinesPolandPortugalPost-demographic dividendPre-demographic dividendPuerto RicoQatarRomaniaRussian FederationRwandaSamoaSan MarinoSao Tome and PrincipeSaudi ArabiaSenegalSerbiaSeychellesSierra LeoneSingaporeSlovak RepublicSloveniaSmall statesSolomon IslandsSomaliaSouth AfricaSouth AsiaSouth Asia (IDA & IBRD)South SudanSpainSri LankaSt. Kitts and NevisSt. LuciaSt. Vincent and the GrenadinesSub-Saharan Africa Sub-Saharan Africa (excluding high income)Sub-Saharan Africa (IDA & IBRD countries)SudanSurinameSwazilandSwedenSwitzerlandSyrian Arab RepublicTajikistanTanzaniaThailandTimor-LesteTogoTongaTrinidad and TobagoTunisiaTurkeyTurkmenistanTurks and Caicos IslandsTuvaluUgandaUkraineUnited Arab EmiratesUnited KingdomUnited StatesUpper middle incomeUruguayUzbekistanVanuatuVenezuela, RBVietnamVirgin Islands (U.S.)West Bank and GazaWorldYemen, Rep.ZambiaZimbabwe Timeline:
This timeline shows a graph from 1961 to 2016 of Cyprus. No data until 1960. Number of actual observations by date: 44.
Source name:
World Development Indicators
Source organization:
International Telecommunication Union, World Telecommunication/ICT Development Report and database.
Categories, topics:
Infrastructure
Last updated:
apr 23, 2017
Indicators value changes by year
Maximum:
46.655
jan 1, 2001
At the date of observation
Value
Absolute change
Change from previous value
jan 1, 1961
1.855
+1.855
0.0%
jan 1, 1966
3.537
+1.682
90.64%
jan 1, 1971
5.436
+1.899
53.69%
jan 1, 1976
6.595
+1.159
21.31%
jan 1, 1977
7.254
+0.659
10.0%
jan 1, 1978
6.513
-0.741
-10.21%
jan 1, 1979
7.924
+1.411
21.66%
jan 1, 1980
8.892
+0.968
12.22%
jan 1, 1981
9.737
+0.844
9.49%
jan 1, 1982
11.202
+1.466
15.06%
jan 1, 1983
12.316
+1.114
9.94%
jan 1, 1984
14.403
+2.087
16.94%
jan 1, 1985
17.122
+2.719
18.88%
jan 1, 1986
19.334
+2.213
12.92%
jan 1, 1987
21.889
+2.554
13.21%
jan 1, 1988
24.899
+3.011
13.76%
jan 1, 1989
27.461
+2.562
10.29%
jan 1, 1990
29.707
+2.246
8.18%
jan 1, 1991
32.082
+2.374
7.99%
jan 1, 1992
34.336
+2.254
7.03%
jan 1, 1993
36.327
+1.991
5.8%
jan 1, 1994
37.981
+1.654
4.55%
jan 1, 1995
39.462
+1.482
3.9%
jan 1, 1996
40.606
+1.144
2.9%
jan 1, 1997
41.954
+1.348
3.32%
jan 1, 1998
43.337
+1.382
3.3%
jan 1, 1999
44.57
+1.233
2.85%
jan 1, 2000
45.82
+1.25
2.81%
jan 1, 2001
46.655
+0.835
1.82%
jan 1, 2002
45.24
-1.415
-3.03%
jan 1, 2003
43.62
-1.62
-3.58%
jan 1, 2004
42.489
-1.131
-2.59%
jan 1, 2005
41.185
-1.304
-3.07%
jan 1, 2006
40.677
-0.507
-1.23%
jan 1, 2007
38.95
-1.727
-4.25%
jan 1, 2008
38.499
-0.451
-1.16%
jan 1, 2009
38.374
-0.125
-0.32%
jan 1, 2010
38.009
-0.365
-0.95%
jan 1, 2011
37.437
-0.572
-1.5%
jan 1, 2012
36.276
-1.162
-3.1%
jan 1, 2013
33.056
-3.22
-8.88%
jan 1, 2014
30.592
-2.463
-7.45%
jan 1, 2015
28.435
-2.157
-7.05%
jan 1, 2016
27.793
-0.642
-2.26%
Ranking of countries by current statistics by years


Comments: