29
/
en
AIzaSyAYiBZKx7MnpbEhh9jyipgxe19OcubqV5w
April 1, 2024
42364
Latin America & Caribbean (excluding high income)
LAC
false
2
1
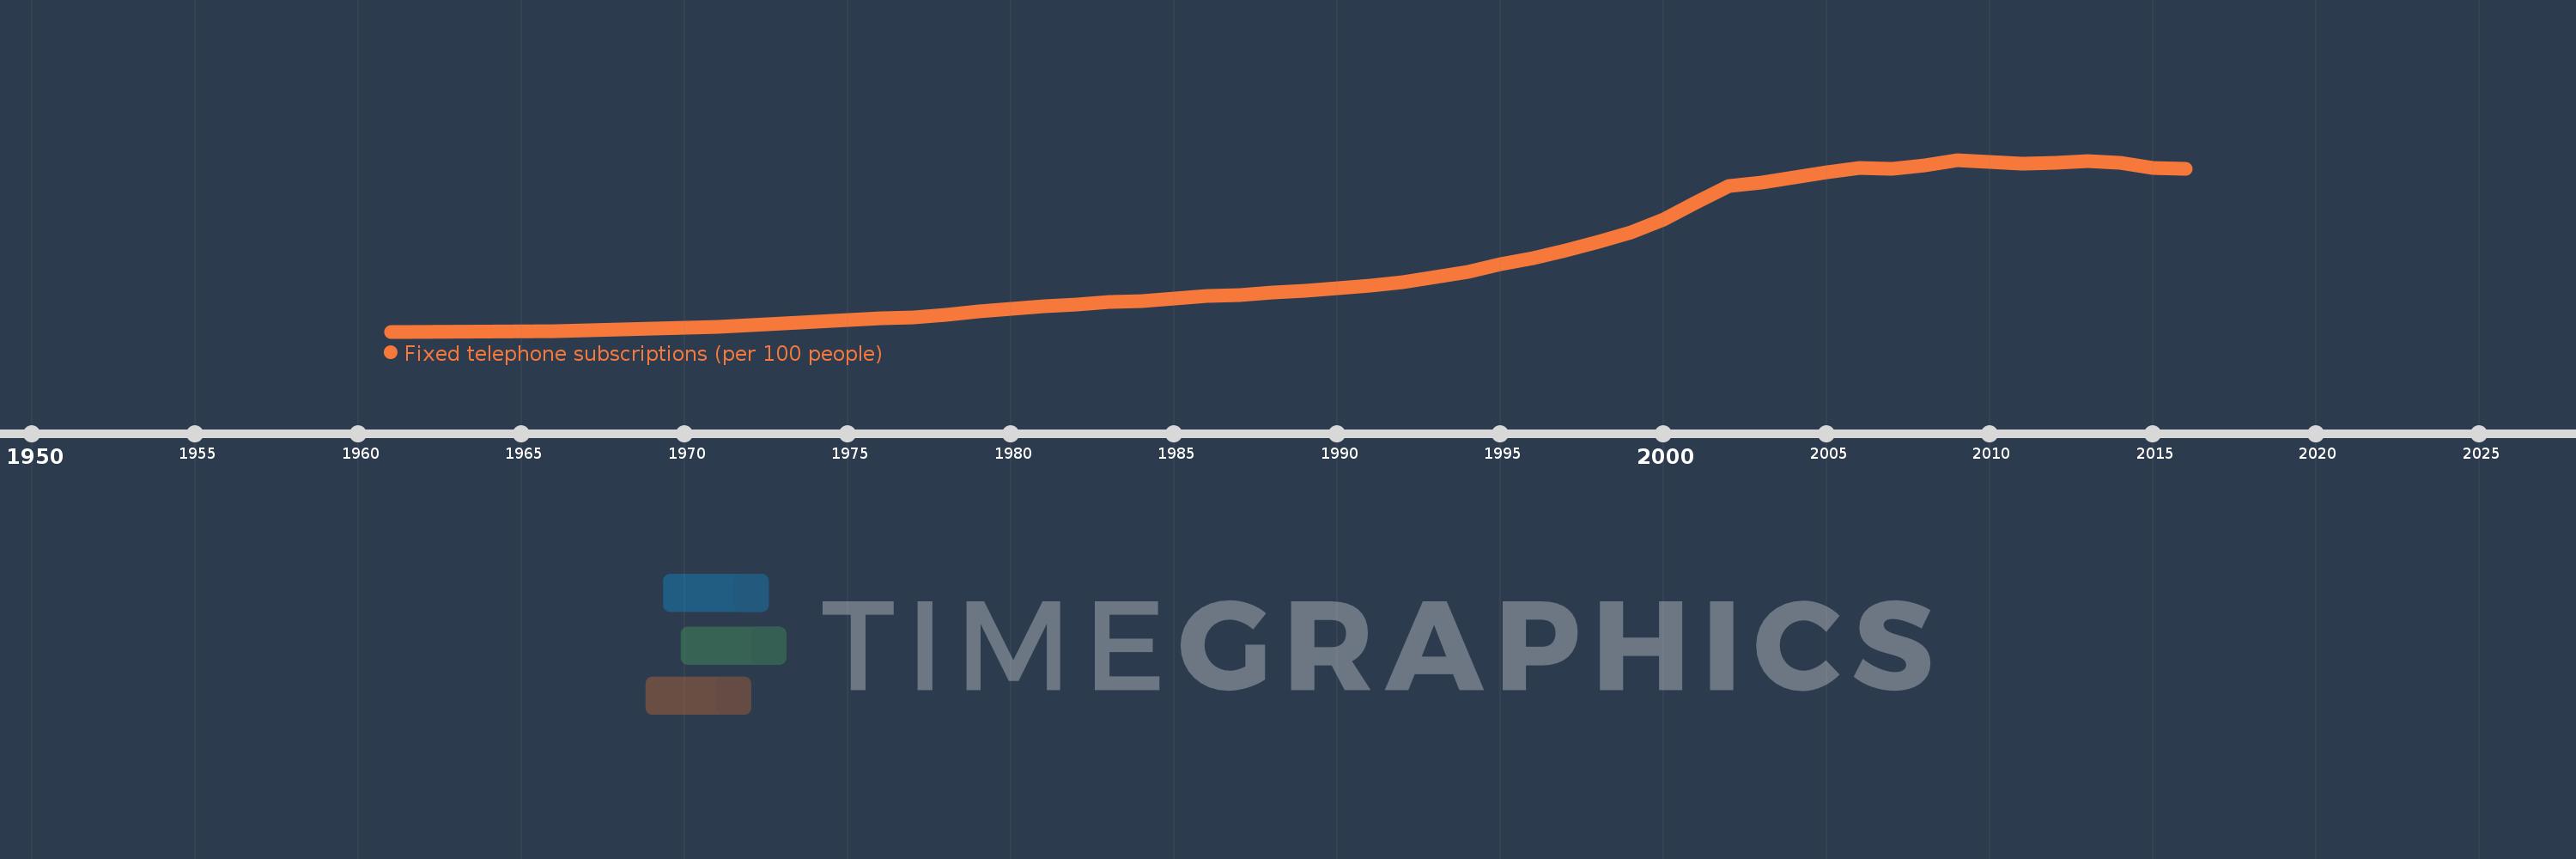
Fixed telephone subscriptions (per 100 people)
2016,2015,2014,2013,2012,2011,2010,2009,2008,2007,2006,2005,2004,2003,2002,2001,2000,1999,1998,1997,1996,1995,1994,1993,1992,1991,1990,1989,1988,1987,1986,1985,1984,1983,1982,1981,1980,1979,1978,1977,1976,1971,1966,1961
This statistics in other country:
AfghanistanAlbaniaAlgeriaAmerican SamoaAndorraAngolaAntigua and BarbudaArab WorldArgentinaArmeniaArubaAustraliaAustriaAzerbaijanBahamas, TheBahrainBangladeshBarbadosBelarusBelgiumBelizeBeninBermudaBhutanBoliviaBosnia and HerzegovinaBotswanaBrazilBritish Virgin IslandsBrunei DarussalamBulgariaBurkina FasoBurundiCabo VerdeCambodiaCameroonCanadaCaribbean small statesCayman IslandsCentral African RepublicCentral Europe and the BalticsChadChileChinaColombiaComorosCongo, Dem. Rep.Congo, Rep.Costa RicaCote d'IvoireCroatiaCubaCuracaoCyprusCzech RepublicDenmarkDjiboutiDominicaDominican RepublicEarly-demographic dividendEast Asia & PacificEast Asia & Pacific (excluding high income)East Asia & Pacific (IDA & IBRD countries)EcuadorEgypt, Arab Rep.El SalvadorEquatorial GuineaEritreaEstoniaEthiopiaEuro areaEurope & Central AsiaEurope & Central Asia (excluding high income)Europe & Central Asia (IDA & IBRD countries)European UnionFaroe IslandsFijiFinlandFragile and conflict affected situationsFranceFrench PolynesiaGabonGambia, TheGeorgiaGermanyGhanaGibraltarGreeceGreenlandGrenadaGuamGuatemalaGuineaGuinea-BissauGuyanaHaitiHeavily indebted poor countries (HIPC)High incomeHondurasHong Kong SAR, ChinaHungaryIBRD onlyIcelandIDA & IBRD totalIDA blendIDA onlyIDA totalIndiaIndonesiaIran, Islamic Rep.IraqIrelandIsraelItalyJamaicaJapanJordanKazakhstanKenyaKiribatiKorea, Dem. People’s Rep.Korea, Rep.KosovoKuwaitKyrgyz RepublicLao PDRLate-demographic dividendLatin America & Caribbean Latin America & Caribbean (excluding high income)Latin America & the Caribbean (IDA & IBRD countries)LatviaLeast developed countries: UN classificationLebanonLesothoLiberiaLibyaLiechtensteinLithuaniaLow & middle incomeLow incomeLower middle incomeLuxembourgMacao SAR, ChinaMacedonia, FYRMadagascarMalawiMalaysiaMaldivesMaliMaltaMarshall IslandsMauritaniaMauritiusMexicoMicronesia, Fed. Sts.Middle East & North AfricaMiddle East & North Africa (excluding high income)Middle East & North Africa (IDA & IBRD countries)Middle incomeMoldovaMonacoMongoliaMontenegroMoroccoMozambiqueMyanmarNamibiaNauruNepalNetherlandsNew CaledoniaNew ZealandNicaraguaNigerNigeriaNorth AmericaNorthern Mariana IslandsNorwayOECD membersOmanOther small statesPacific island small statesPakistanPalauPanamaPapua New GuineaParaguayPeruPhilippinesPolandPortugalPost-demographic dividendPre-demographic dividendPuerto RicoQatarRomaniaRussian FederationRwandaSamoaSan MarinoSao Tome and PrincipeSaudi ArabiaSenegalSerbiaSeychellesSierra LeoneSingaporeSlovak RepublicSloveniaSmall statesSolomon IslandsSomaliaSouth AfricaSouth AsiaSouth Asia (IDA & IBRD)South SudanSpainSri LankaSt. Kitts and NevisSt. LuciaSt. Vincent and the GrenadinesSub-Saharan Africa Sub-Saharan Africa (excluding high income)Sub-Saharan Africa (IDA & IBRD countries)SudanSurinameSwazilandSwedenSwitzerlandSyrian Arab RepublicTajikistanTanzaniaThailandTimor-LesteTogoTongaTrinidad and TobagoTunisiaTurkeyTurkmenistanTurks and Caicos IslandsTuvaluUgandaUkraineUnited Arab EmiratesUnited KingdomUnited StatesUpper middle incomeUruguayUzbekistanVanuatuVenezuela, RBVietnamVirgin Islands (U.S.)West Bank and GazaWorldYemen, Rep.ZambiaZimbabwe Timeline:
This timeline shows a graph from 1961 to 2016 of Latin America & Caribbean (excluding high income). No data until 1960. Number of actual observations by date: 44.
Source name:
World Development Indicators
Source organization:
International Telecommunication Union, World Telecommunication/ICT Development Report and database.
Categories, topics:
Infrastructure
Last updated:
apr 23, 2017
Indicators value changes by year
Maximum:
18.081
jan 1, 2009
At the date of observation
Value
Absolute change
Change from previous value
jan 1, 1961
1.461
+1.461
0.0%
jan 1, 1966
1.543
+0.081
5.55%
jan 1, 1971
1.93
+0.388
25.13%
jan 1, 1976
2.709
+0.779
40.34%
jan 1, 1977
2.859
+0.151
5.57%
jan 1, 1978
3.116
+0.257
8.99%
jan 1, 1979
3.417
+0.301
9.66%
jan 1, 1980
3.656
+0.239
6.99%
jan 1, 1981
3.907
+0.251
6.86%
jan 1, 1982
4.046
+0.139
3.55%
jan 1, 1983
4.292
+0.246
6.08%
jan 1, 1984
4.407
+0.115
2.68%
jan 1, 1985
4.661
+0.254
5.77%
jan 1, 1986
4.892
+0.231
4.95%
jan 1, 1987
5.028
+0.136
2.78%
jan 1, 1988
5.217
+0.189
3.75%
jan 1, 1989
5.439
+0.222
4.26%
jan 1, 1990
5.63
+0.191
3.51%
jan 1, 1991
5.908
+0.278
4.94%
jan 1, 1992
6.252
+0.344
5.83%
jan 1, 1993
6.763
+0.511
8.17%
jan 1, 1994
7.246
+0.483
7.15%
jan 1, 1995
7.986
+0.74
10.21%
jan 1, 1996
8.545
+0.558
6.99%
jan 1, 1997
9.308
+0.764
8.94%
jan 1, 1998
10.153
+0.844
9.07%
jan 1, 1999
11.056
+0.904
8.9%
jan 1, 2000
12.347
+1.291
11.68%
jan 1, 2001
13.985
+1.637
13.26%
jan 1, 2002
15.519
+1.534
10.97%
jan 1, 2003
15.915
+0.396
2.55%
jan 1, 2004
16.392
+0.478
3.0%
jan 1, 2005
16.835
+0.443
2.7%
jan 1, 2006
17.277
+0.442
2.63%
jan 1, 2007
17.225
-0.052
-0.3%
jan 1, 2008
17.503
+0.278
1.61%
jan 1, 2009
18.081
+0.578
3.3%
jan 1, 2010
17.847
-0.233
-1.29%
jan 1, 2011
17.703
-0.144
-0.81%
jan 1, 2012
17.753
+0.049
0.28%
jan 1, 2013
17.95
+0.198
1.11%
jan 1, 2014
17.815
-0.135
-0.75%
jan 1, 2015
17.315
-0.5
-2.81%
jan 1, 2016
17.219
-0.096
-0.56%
Ranking of countries by current statistics by years


Comments: