29
/
en
AIzaSyAYiBZKx7MnpbEhh9jyipgxe19OcubqV5w
April 1, 2024
107222
Colombia
COL
true
2
1
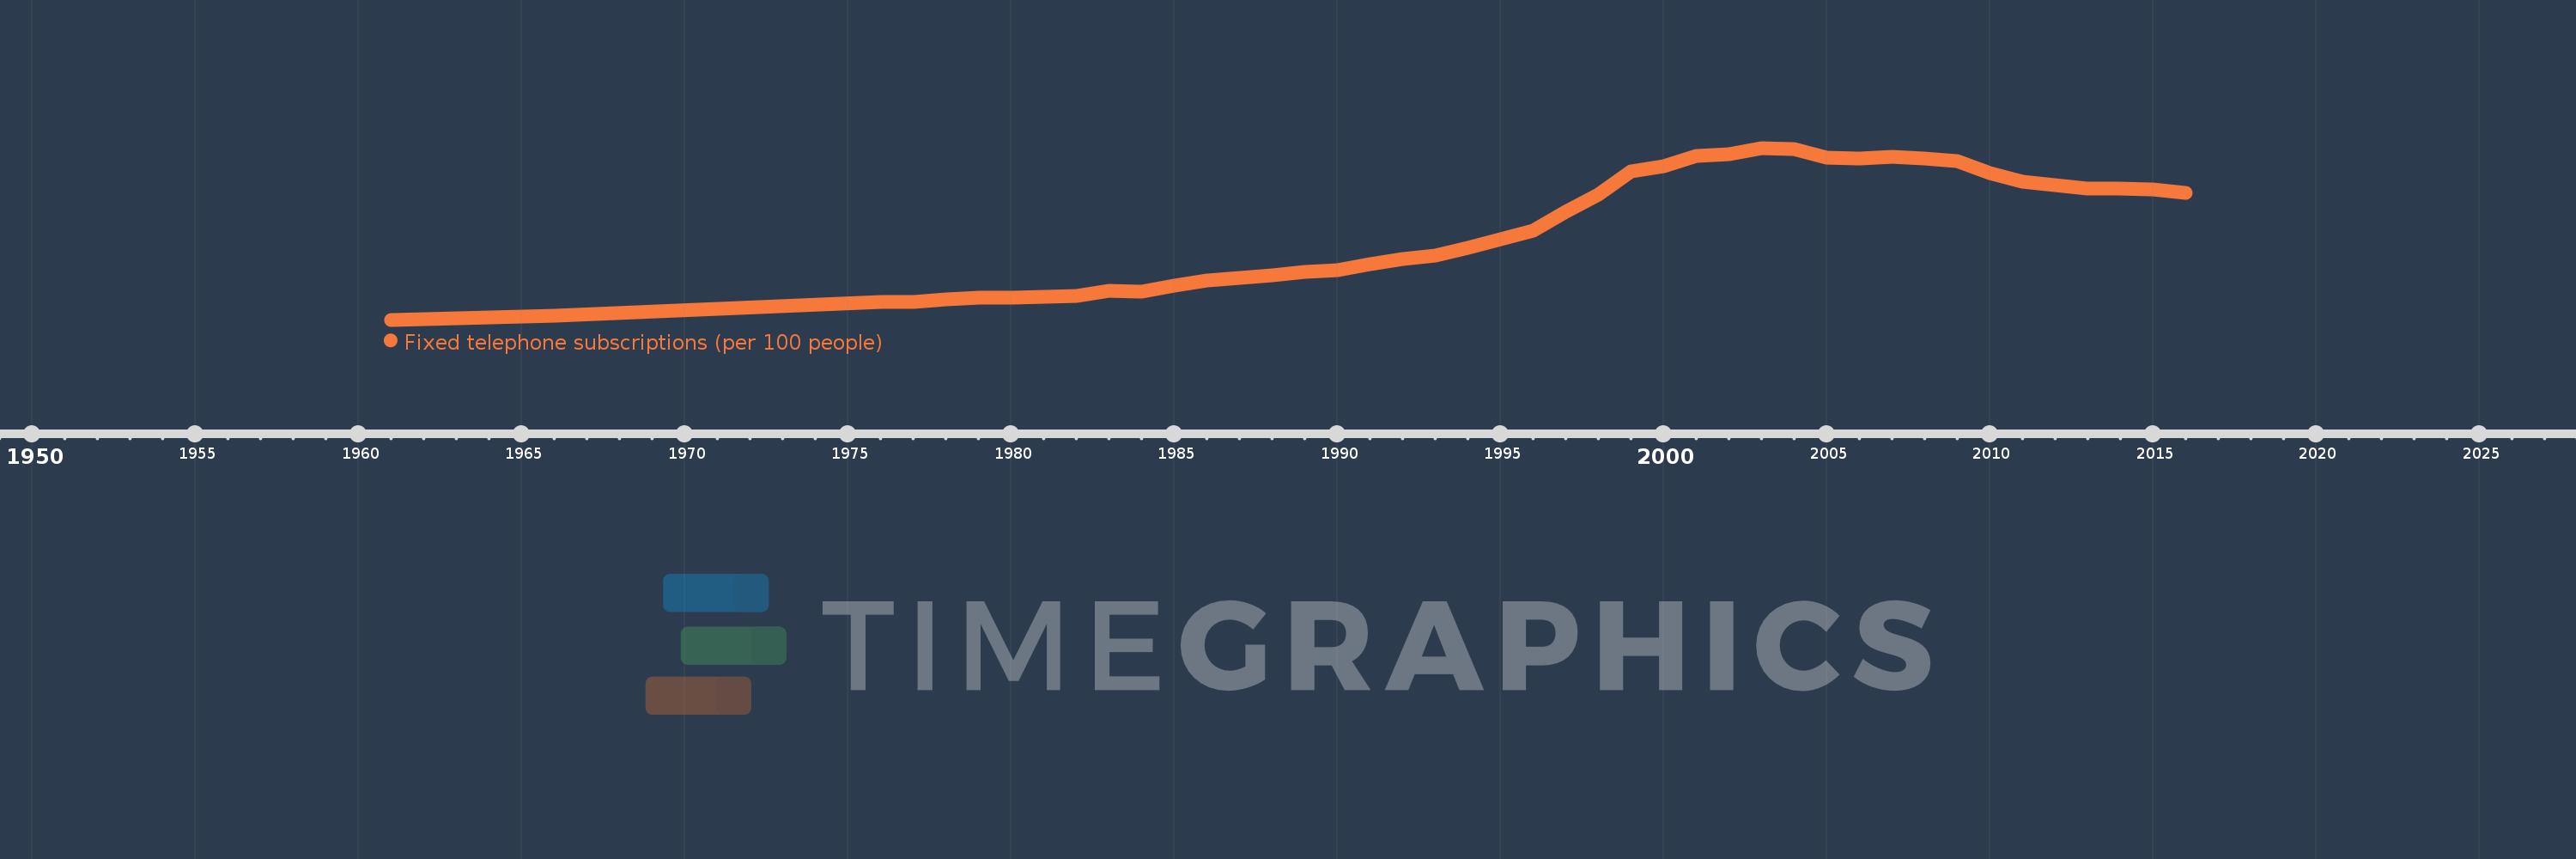
Fixed telephone subscriptions (per 100 people)
2016,2015,2014,2013,2012,2011,2010,2009,2008,2007,2006,2005,2004,2003,2002,2001,2000,1999,1998,1997,1996,1995,1994,1993,1992,1991,1990,1989,1988,1987,1986,1985,1984,1983,1982,1981,1980,1979,1978,1977,1976,1971,1966,1961
This statistics in other country:
AfghanistanAlbaniaAlgeriaAmerican SamoaAndorraAngolaAntigua and BarbudaArab WorldArgentinaArmeniaArubaAustraliaAustriaAzerbaijanBahamas, TheBahrainBangladeshBarbadosBelarusBelgiumBelizeBeninBermudaBhutanBoliviaBosnia and HerzegovinaBotswanaBrazilBritish Virgin IslandsBrunei DarussalamBulgariaBurkina FasoBurundiCabo VerdeCambodiaCameroonCanadaCaribbean small statesCayman IslandsCentral African RepublicCentral Europe and the BalticsChadChileChinaColombiaComorosCongo, Dem. Rep.Congo, Rep.Costa RicaCote d'IvoireCroatiaCubaCuracaoCyprusCzech RepublicDenmarkDjiboutiDominicaDominican RepublicEarly-demographic dividendEast Asia & PacificEast Asia & Pacific (excluding high income)East Asia & Pacific (IDA & IBRD countries)EcuadorEgypt, Arab Rep.El SalvadorEquatorial GuineaEritreaEstoniaEthiopiaEuro areaEurope & Central AsiaEurope & Central Asia (excluding high income)Europe & Central Asia (IDA & IBRD countries)European UnionFaroe IslandsFijiFinlandFragile and conflict affected situationsFranceFrench PolynesiaGabonGambia, TheGeorgiaGermanyGhanaGibraltarGreeceGreenlandGrenadaGuamGuatemalaGuineaGuinea-BissauGuyanaHaitiHeavily indebted poor countries (HIPC)High incomeHondurasHong Kong SAR, ChinaHungaryIBRD onlyIcelandIDA & IBRD totalIDA blendIDA onlyIDA totalIndiaIndonesiaIran, Islamic Rep.IraqIrelandIsraelItalyJamaicaJapanJordanKazakhstanKenyaKiribatiKorea, Dem. People’s Rep.Korea, Rep.KosovoKuwaitKyrgyz RepublicLao PDRLate-demographic dividendLatin America & Caribbean Latin America & Caribbean (excluding high income)Latin America & the Caribbean (IDA & IBRD countries)LatviaLeast developed countries: UN classificationLebanonLesothoLiberiaLibyaLiechtensteinLithuaniaLow & middle incomeLow incomeLower middle incomeLuxembourgMacao SAR, ChinaMacedonia, FYRMadagascarMalawiMalaysiaMaldivesMaliMaltaMarshall IslandsMauritaniaMauritiusMexicoMicronesia, Fed. Sts.Middle East & North AfricaMiddle East & North Africa (excluding high income)Middle East & North Africa (IDA & IBRD countries)Middle incomeMoldovaMonacoMongoliaMontenegroMoroccoMozambiqueMyanmarNamibiaNauruNepalNetherlandsNew CaledoniaNew ZealandNicaraguaNigerNigeriaNorth AmericaNorthern Mariana IslandsNorwayOECD membersOmanOther small statesPacific island small statesPakistanPalauPanamaPapua New GuineaParaguayPeruPhilippinesPolandPortugalPost-demographic dividendPre-demographic dividendPuerto RicoQatarRomaniaRussian FederationRwandaSamoaSan MarinoSao Tome and PrincipeSaudi ArabiaSenegalSerbiaSeychellesSierra LeoneSingaporeSlovak RepublicSloveniaSmall statesSolomon IslandsSomaliaSouth AfricaSouth AsiaSouth Asia (IDA & IBRD)South SudanSpainSri LankaSt. Kitts and NevisSt. LuciaSt. Vincent and the GrenadinesSub-Saharan Africa Sub-Saharan Africa (excluding high income)Sub-Saharan Africa (IDA & IBRD countries)SudanSurinameSwazilandSwedenSwitzerlandSyrian Arab RepublicTajikistanTanzaniaThailandTimor-LesteTogoTongaTrinidad and TobagoTunisiaTurkeyTurkmenistanTurks and Caicos IslandsTuvaluUgandaUkraineUnited Arab EmiratesUnited KingdomUnited StatesUpper middle incomeUruguayUzbekistanVanuatuVenezuela, RBVietnamVirgin Islands (U.S.)West Bank and GazaWorldYemen, Rep.ZambiaZimbabwe Timeline:
This timeline shows a graph from 1961 to 2016 of Colombia. No data until 1960. Number of actual observations by date: 44.
Source name:
World Development Indicators
Source organization:
International Telecommunication Union, World Telecommunication/ICT Development Report and database.
Categories, topics:
Infrastructure
Last updated:
apr 23, 2017
Indicators value changes by year
Maximum:
18.842
jan 1, 2003
At the date of observation
Value
Absolute change
Change from previous value
jan 1, 1961
1.718
+1.718
0.0%
jan 1, 1966
2.118
+0.4
23.28%
jan 1, 1971
2.792
+0.675
31.86%
jan 1, 1976
3.491
+0.698
25.01%
jan 1, 1977
3.507
+0.016
0.47%
jan 1, 1978
3.726
+0.219
6.26%
jan 1, 1979
3.929
+0.203
5.44%
jan 1, 1980
3.883
-0.046
-1.17%
jan 1, 1981
3.994
+0.111
2.85%
jan 1, 1982
4.118
+0.124
3.11%
jan 1, 1983
4.59
+0.472
11.46%
jan 1, 1984
4.509
-0.08
-1.75%
jan 1, 1985
5.117
+0.608
13.48%
jan 1, 1986
5.66
+0.543
10.6%
jan 1, 1987
5.856
+0.196
3.46%
jan 1, 1988
6.117
+0.261
4.45%
jan 1, 1989
6.468
+0.352
5.75%
jan 1, 1990
6.665
+0.197
3.04%
jan 1, 1991
7.25
+0.585
8.78%
jan 1, 1992
7.755
+0.505
6.96%
jan 1, 1993
8.153
+0.399
5.14%
jan 1, 1994
8.904
+0.75
9.2%
jan 1, 1995
9.781
+0.878
9.86%
jan 1, 1996
10.589
+0.808
8.26%
jan 1, 1997
12.476
+1.887
17.82%
jan 1, 1998
14.234
+1.758
14.09%
jan 1, 1999
16.508
+2.275
15.98%
jan 1, 2000
16.989
+0.481
2.91%
jan 1, 2001
18.028
+1.039
6.12%
jan 1, 2002
18.175
+0.147
0.82%
jan 1, 2003
18.842
+0.667
3.67%
jan 1, 2004
18.743
-0.099
-0.52%
jan 1, 2005
17.844
-0.899
-4.8%
jan 1, 2006
17.782
-0.063
-0.35%
jan 1, 2007
17.929
+0.147
0.83%
jan 1, 2008
17.808
-0.121
-0.68%
jan 1, 2009
17.56
-0.247
-1.39%
jan 1, 2010
16.318
-1.243
-7.08%
jan 1, 2011
15.472
-0.845
-5.18%
jan 1, 2012
15.138
-0.335
-2.16%
jan 1, 2013
14.812
-0.326
-2.15%
jan 1, 2014
14.779
-0.033
-0.22%
jan 1, 2015
14.676
-0.103
-0.7%
jan 1, 2016
14.354
-0.322
-2.2%
Ranking of countries by current statistics by years


Comments: