29
/
en
AIzaSyAYiBZKx7MnpbEhh9jyipgxe19OcubqV5w
April 1, 2024
61592
Upper middle income
UMC
false
2
1
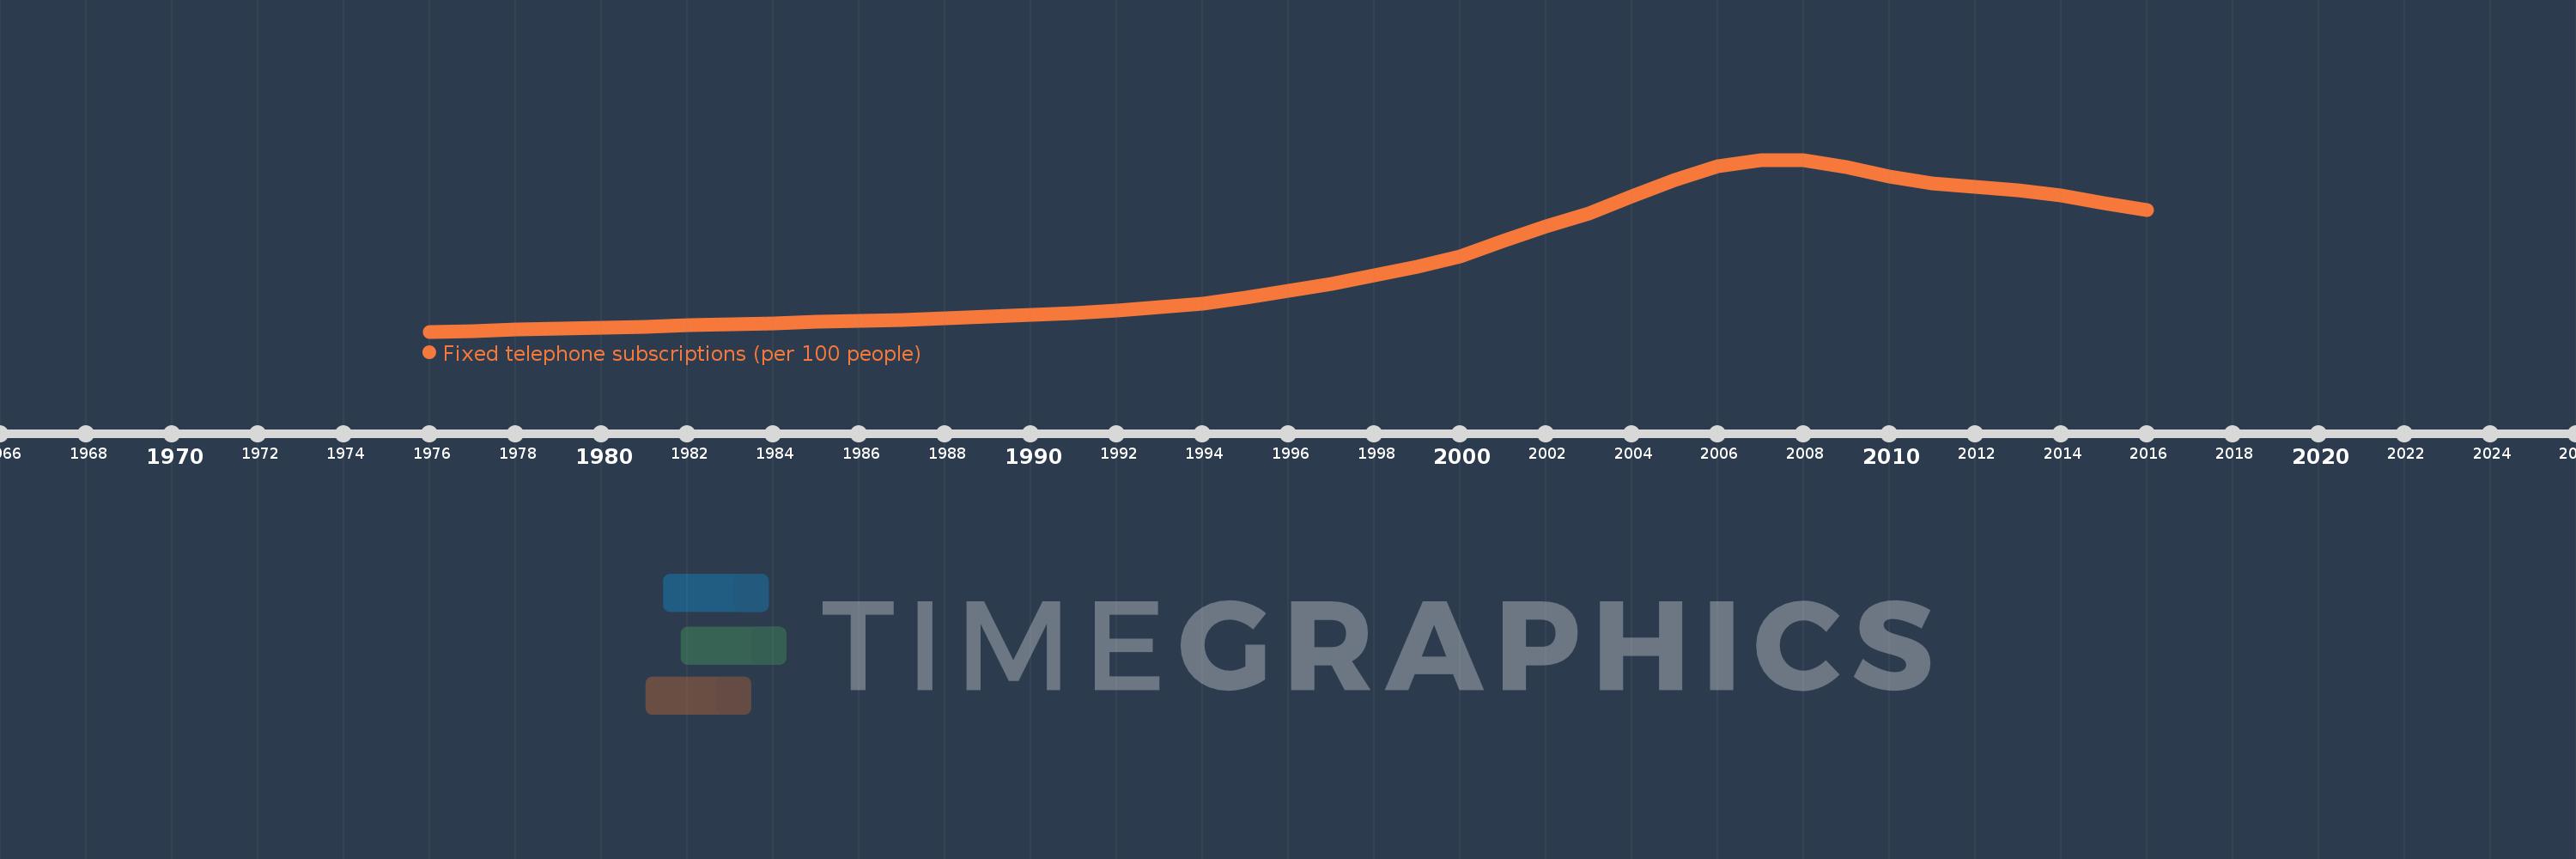
Fixed telephone subscriptions (per 100 people)
2016,2015,2014,2013,2012,2011,2010,2009,2008,2007,2006,2005,2004,2003,2002,2001,2000,1999,1998,1997,1996,1995,1994,1993,1992,1991,1990,1989,1988,1987,1986,1985,1984,1983,1982,1981,1980,1979,1978,1977,1976
This statistics in other country:
AfghanistanAlbaniaAlgeriaAmerican SamoaAndorraAngolaAntigua and BarbudaArab WorldArgentinaArmeniaArubaAustraliaAustriaAzerbaijanBahamas, TheBahrainBangladeshBarbadosBelarusBelgiumBelizeBeninBermudaBhutanBoliviaBosnia and HerzegovinaBotswanaBrazilBritish Virgin IslandsBrunei DarussalamBulgariaBurkina FasoBurundiCabo VerdeCambodiaCameroonCanadaCaribbean small statesCayman IslandsCentral African RepublicCentral Europe and the BalticsChadChileChinaColombiaComorosCongo, Dem. Rep.Congo, Rep.Costa RicaCote d'IvoireCroatiaCubaCuracaoCyprusCzech RepublicDenmarkDjiboutiDominicaDominican RepublicEarly-demographic dividendEast Asia & PacificEast Asia & Pacific (excluding high income)East Asia & Pacific (IDA & IBRD countries)EcuadorEgypt, Arab Rep.El SalvadorEquatorial GuineaEritreaEstoniaEthiopiaEuro areaEurope & Central AsiaEurope & Central Asia (excluding high income)Europe & Central Asia (IDA & IBRD countries)European UnionFaroe IslandsFijiFinlandFragile and conflict affected situationsFranceFrench PolynesiaGabonGambia, TheGeorgiaGermanyGhanaGibraltarGreeceGreenlandGrenadaGuamGuatemalaGuineaGuinea-BissauGuyanaHaitiHeavily indebted poor countries (HIPC)High incomeHondurasHong Kong SAR, ChinaHungaryIBRD onlyIcelandIDA & IBRD totalIDA blendIDA onlyIDA totalIndiaIndonesiaIran, Islamic Rep.IraqIrelandIsraelItalyJamaicaJapanJordanKazakhstanKenyaKiribatiKorea, Dem. People’s Rep.Korea, Rep.KosovoKuwaitKyrgyz RepublicLao PDRLate-demographic dividendLatin America & Caribbean Latin America & Caribbean (excluding high income)Latin America & the Caribbean (IDA & IBRD countries)LatviaLeast developed countries: UN classificationLebanonLesothoLiberiaLibyaLiechtensteinLithuaniaLow & middle incomeLow incomeLower middle incomeLuxembourgMacao SAR, ChinaMacedonia, FYRMadagascarMalawiMalaysiaMaldivesMaliMaltaMarshall IslandsMauritaniaMauritiusMexicoMicronesia, Fed. Sts.Middle East & North AfricaMiddle East & North Africa (excluding high income)Middle East & North Africa (IDA & IBRD countries)Middle incomeMoldovaMonacoMongoliaMontenegroMoroccoMozambiqueMyanmarNamibiaNauruNepalNetherlandsNew CaledoniaNew ZealandNicaraguaNigerNigeriaNorth AmericaNorthern Mariana IslandsNorwayOECD membersOmanOther small statesPacific island small statesPakistanPalauPanamaPapua New GuineaParaguayPeruPhilippinesPolandPortugalPost-demographic dividendPre-demographic dividendPuerto RicoQatarRomaniaRussian FederationRwandaSamoaSan MarinoSao Tome and PrincipeSaudi ArabiaSenegalSerbiaSeychellesSierra LeoneSingaporeSlovak RepublicSloveniaSmall statesSolomon IslandsSomaliaSouth AfricaSouth AsiaSouth Asia (IDA & IBRD)South SudanSpainSri LankaSt. Kitts and NevisSt. LuciaSt. Vincent and the GrenadinesSub-Saharan Africa Sub-Saharan Africa (excluding high income)Sub-Saharan Africa (IDA & IBRD countries)SudanSurinameSwazilandSwedenSwitzerlandSyrian Arab RepublicTajikistanTanzaniaThailandTimor-LesteTogoTongaTrinidad and TobagoTunisiaTurkeyTurkmenistanTurks and Caicos IslandsTuvaluUgandaUkraineUnited Arab EmiratesUnited KingdomUnited StatesUpper middle incomeUruguayUzbekistanVanuatuVenezuela, RBVietnamVirgin Islands (U.S.)West Bank and GazaWorldYemen, Rep.ZambiaZimbabwe Timeline:
This timeline shows a graph from 1976 to 2016 of Upper middle income. No data until 1975. Number of actual observations by date: 41.
Source name:
World Development Indicators
Source organization:
International Telecommunication Union, World Telecommunication/ICT Development Report and database.
Categories, topics:
Infrastructure
Last updated:
apr 23, 2017
Indicators value changes by year
Maximum:
24.039
jan 1, 2007
At the date of observation
Value
Absolute change
Change from previous value
jan 1, 1976
1.321
+1.321
0.0%
jan 1, 1977
1.427
+0.106
8.01%
jan 1, 1978
1.576
+0.149
10.43%
jan 1, 1979
1.71
+0.134
8.51%
jan 1, 1980
1.876
+0.167
9.75%
jan 1, 1981
1.991
+0.114
6.08%
jan 1, 1982
2.168
+0.177
8.9%
jan 1, 1983
2.31
+0.142
6.56%
jan 1, 1984
2.434
+0.125
5.4%
jan 1, 1985
2.585
+0.151
6.18%
jan 1, 1986
2.744
+0.159
6.14%
jan 1, 1987
2.909
+0.166
6.03%
jan 1, 1988
3.101
+0.192
6.59%
jan 1, 1989
3.334
+0.233
7.53%
jan 1, 1990
3.551
+0.217
6.52%
jan 1, 1991
3.81
+0.258
7.27%
jan 1, 1992
4.118
+0.308
8.09%
jan 1, 1993
4.513
+0.394
9.58%
jan 1, 1994
5.056
+0.544
12.05%
jan 1, 1995
5.81
+0.753
14.9%
jan 1, 1996
6.698
+0.888
15.29%
jan 1, 1997
7.67
+0.972
14.51%
jan 1, 1998
8.778
+1.108
14.45%
jan 1, 1999
9.879
+1.101
12.55%
jan 1, 2000
11.255
+1.376
13.93%
jan 1, 2001
13.272
+2.017
17.92%
jan 1, 2002
15.261
+1.989
14.98%
jan 1, 2003
16.952
+1.691
11.08%
jan 1, 2004
19.161
+2.209
13.03%
jan 1, 2005
21.4
+2.239
11.68%
jan 1, 2006
23.217
+1.817
8.49%
jan 1, 2007
24.039
+0.822
3.54%
jan 1, 2008
24.003
-0.036
-0.15%
jan 1, 2009
23.025
-0.978
-4.07%
jan 1, 2010
21.81
-1.215
-5.28%
jan 1, 2011
20.891
-0.919
-4.21%
jan 1, 2012
20.437
-0.453
-2.17%
jan 1, 2013
19.991
-0.446
-2.18%
jan 1, 2014
19.312
-0.679
-3.4%
jan 1, 2015
18.246
-1.066
-5.52%
jan 1, 2016
17.339
-0.907
-4.97%
Ranking of countries by current statistics by years


Comments: