29
/
en
AIzaSyAYiBZKx7MnpbEhh9jyipgxe19OcubqV5w
April 1, 2024
115775
Cuba
CUB
true
2
1
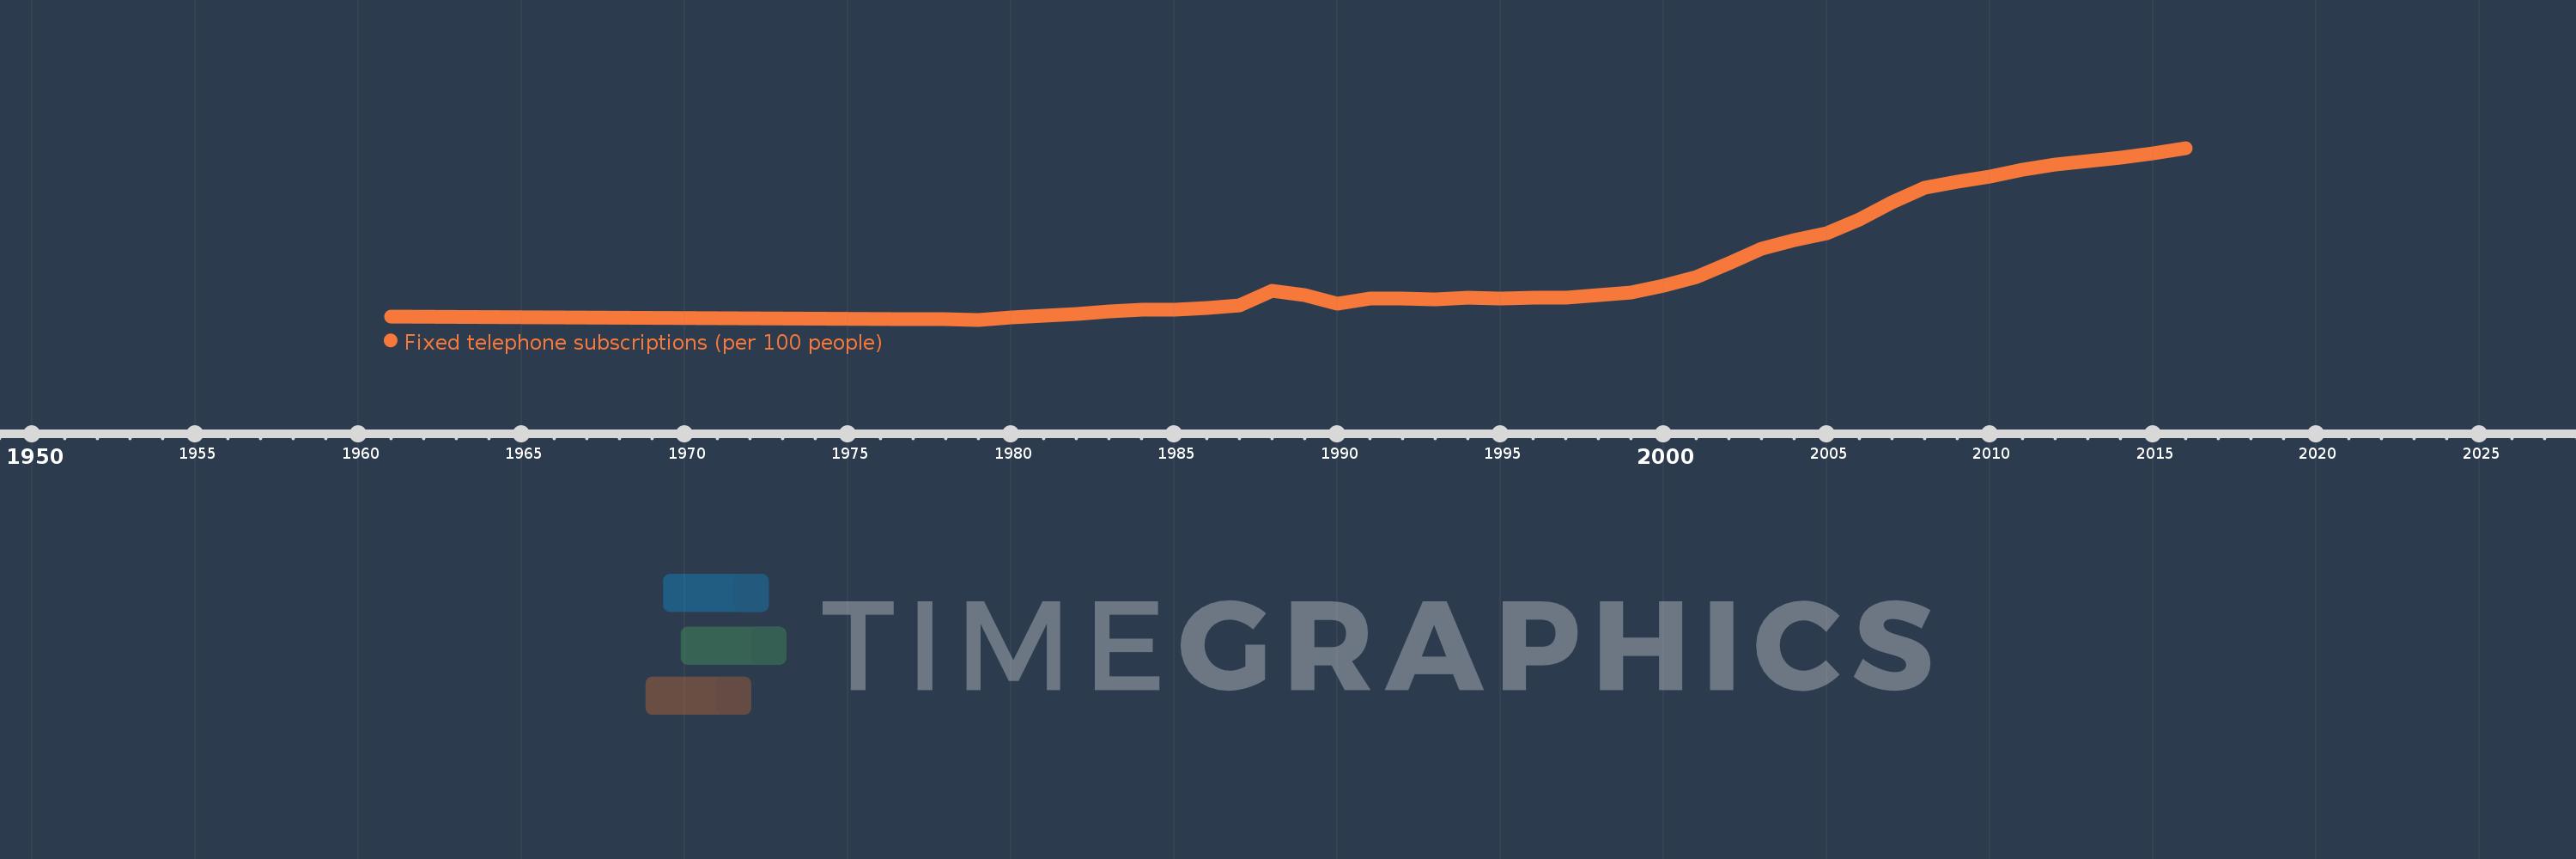
Fixed telephone subscriptions (per 100 people)
2016,2015,2014,2013,2012,2011,2010,2009,2008,2007,2006,2005,2004,2003,2002,2001,2000,1999,1998,1997,1996,1995,1994,1993,1992,1991,1990,1989,1988,1987,1986,1985,1984,1983,1982,1980,1979,1978,1977,1961
This statistics in other country:
AfghanistanAlbaniaAlgeriaAmerican SamoaAndorraAngolaAntigua and BarbudaArab WorldArgentinaArmeniaArubaAustraliaAustriaAzerbaijanBahamas, TheBahrainBangladeshBarbadosBelarusBelgiumBelizeBeninBermudaBhutanBoliviaBosnia and HerzegovinaBotswanaBrazilBritish Virgin IslandsBrunei DarussalamBulgariaBurkina FasoBurundiCabo VerdeCambodiaCameroonCanadaCaribbean small statesCayman IslandsCentral African RepublicCentral Europe and the BalticsChadChileChinaColombiaComorosCongo, Dem. Rep.Congo, Rep.Costa RicaCote d'IvoireCroatiaCubaCuracaoCyprusCzech RepublicDenmarkDjiboutiDominicaDominican RepublicEarly-demographic dividendEast Asia & PacificEast Asia & Pacific (excluding high income)East Asia & Pacific (IDA & IBRD countries)EcuadorEgypt, Arab Rep.El SalvadorEquatorial GuineaEritreaEstoniaEthiopiaEuro areaEurope & Central AsiaEurope & Central Asia (excluding high income)Europe & Central Asia (IDA & IBRD countries)European UnionFaroe IslandsFijiFinlandFragile and conflict affected situationsFranceFrench PolynesiaGabonGambia, TheGeorgiaGermanyGhanaGibraltarGreeceGreenlandGrenadaGuamGuatemalaGuineaGuinea-BissauGuyanaHaitiHeavily indebted poor countries (HIPC)High incomeHondurasHong Kong SAR, ChinaHungaryIBRD onlyIcelandIDA & IBRD totalIDA blendIDA onlyIDA totalIndiaIndonesiaIran, Islamic Rep.IraqIrelandIsraelItalyJamaicaJapanJordanKazakhstanKenyaKiribatiKorea, Dem. People’s Rep.Korea, Rep.KosovoKuwaitKyrgyz RepublicLao PDRLate-demographic dividendLatin America & Caribbean Latin America & Caribbean (excluding high income)Latin America & the Caribbean (IDA & IBRD countries)LatviaLeast developed countries: UN classificationLebanonLesothoLiberiaLibyaLiechtensteinLithuaniaLow & middle incomeLow incomeLower middle incomeLuxembourgMacao SAR, ChinaMacedonia, FYRMadagascarMalawiMalaysiaMaldivesMaliMaltaMarshall IslandsMauritaniaMauritiusMexicoMicronesia, Fed. Sts.Middle East & North AfricaMiddle East & North Africa (excluding high income)Middle East & North Africa (IDA & IBRD countries)Middle incomeMoldovaMonacoMongoliaMontenegroMoroccoMozambiqueMyanmarNamibiaNauruNepalNetherlandsNew CaledoniaNew ZealandNicaraguaNigerNigeriaNorth AmericaNorthern Mariana IslandsNorwayOECD membersOmanOther small statesPacific island small statesPakistanPalauPanamaPapua New GuineaParaguayPeruPhilippinesPolandPortugalPost-demographic dividendPre-demographic dividendPuerto RicoQatarRomaniaRussian FederationRwandaSamoaSan MarinoSao Tome and PrincipeSaudi ArabiaSenegalSerbiaSeychellesSierra LeoneSingaporeSlovak RepublicSloveniaSmall statesSolomon IslandsSomaliaSouth AfricaSouth AsiaSouth Asia (IDA & IBRD)South SudanSpainSri LankaSt. Kitts and NevisSt. LuciaSt. Vincent and the GrenadinesSub-Saharan Africa Sub-Saharan Africa (excluding high income)Sub-Saharan Africa (IDA & IBRD countries)SudanSurinameSwazilandSwedenSwitzerlandSyrian Arab RepublicTajikistanTanzaniaThailandTimor-LesteTogoTongaTrinidad and TobagoTunisiaTurkeyTurkmenistanTurks and Caicos IslandsTuvaluUgandaUkraineUnited Arab EmiratesUnited KingdomUnited StatesUpper middle incomeUruguayUzbekistanVanuatuVenezuela, RBVietnamVirgin Islands (U.S.)West Bank and GazaWorldYemen, Rep.ZambiaZimbabwe Timeline:
This timeline shows a graph from 1961 to 2016 of Cuba. No data until 1960. Number of actual observations by date: 40.
Source name:
World Development Indicators
Source organization:
International Telecommunication Union, World Telecommunication/ICT Development Report and database.
Categories, topics:
Infrastructure
Last updated:
apr 23, 2017
Indicators value changes by year
At the date of observation
Value
Absolute change
Change from previous value
jan 1, 1961
2.176
+2.176
0.0%
jan 1, 1977
2.064
-0.112
-5.15%
jan 1, 1978
2.045
-0.019
-0.93%
jan 1, 1979
2.019
-0.026
-1.29%
jan 1, 1980
2.158
+0.14
6.93%
jan 1, 1982
2.348
+0.189
8.77%
jan 1, 1983
2.457
+0.109
4.66%
jan 1, 1984
2.556
+0.099
4.04%
jan 1, 1985
2.558
+0.001
0.05%
jan 1, 1986
2.66
+0.103
4.01%
jan 1, 1987
2.826
+0.166
6.24%
jan 1, 1988
3.601
+0.775
27.42%
jan 1, 1989
3.398
-0.203
-5.63%
jan 1, 1990
2.895
-0.503
-14.81%
jan 1, 1991
3.176
+0.28
9.69%
jan 1, 1992
3.173
-0.002
-0.08%
jan 1, 1993
3.132
-0.041
-1.3%
jan 1, 1994
3.225
+0.093
2.97%
jan 1, 1995
3.212
-0.013
-0.39%
jan 1, 1996
3.231
+0.018
0.56%
jan 1, 1997
3.243
+0.013
0.4%
jan 1, 1998
3.363
+0.12
3.7%
jan 1, 1999
3.504
+0.14
4.17%
jan 1, 2000
3.907
+0.404
11.52%
jan 1, 2001
4.387
+0.479
12.27%
jan 1, 2002
5.14
+0.753
17.17%
jan 1, 2003
5.937
+0.797
15.5%
jan 1, 2004
6.44
+0.503
8.48%
jan 1, 2005
6.814
+0.374
5.81%
jan 1, 2006
7.58
+0.766
11.24%
jan 1, 2007
8.509
+0.929
12.25%
jan 1, 2008
9.336
+0.827
9.72%
jan 1, 2009
9.632
+0.296
3.17%
jan 1, 2010
9.919
+0.287
2.98%
jan 1, 2011
10.314
+0.395
3.98%
jan 1, 2012
10.584
+0.269
2.61%
jan 1, 2013
10.793
+0.21
1.98%
jan 1, 2014
10.983
+0.189
1.75%
jan 1, 2015
11.234
+0.251
2.29%
jan 1, 2016
11.52
+0.286
2.54%
Ranking of countries by current statistics by years


Comments: