29
/
en
AIzaSyAYiBZKx7MnpbEhh9jyipgxe19OcubqV5w
April 1, 2024
30662
Europe & Central Asia
ECS
false
2
1
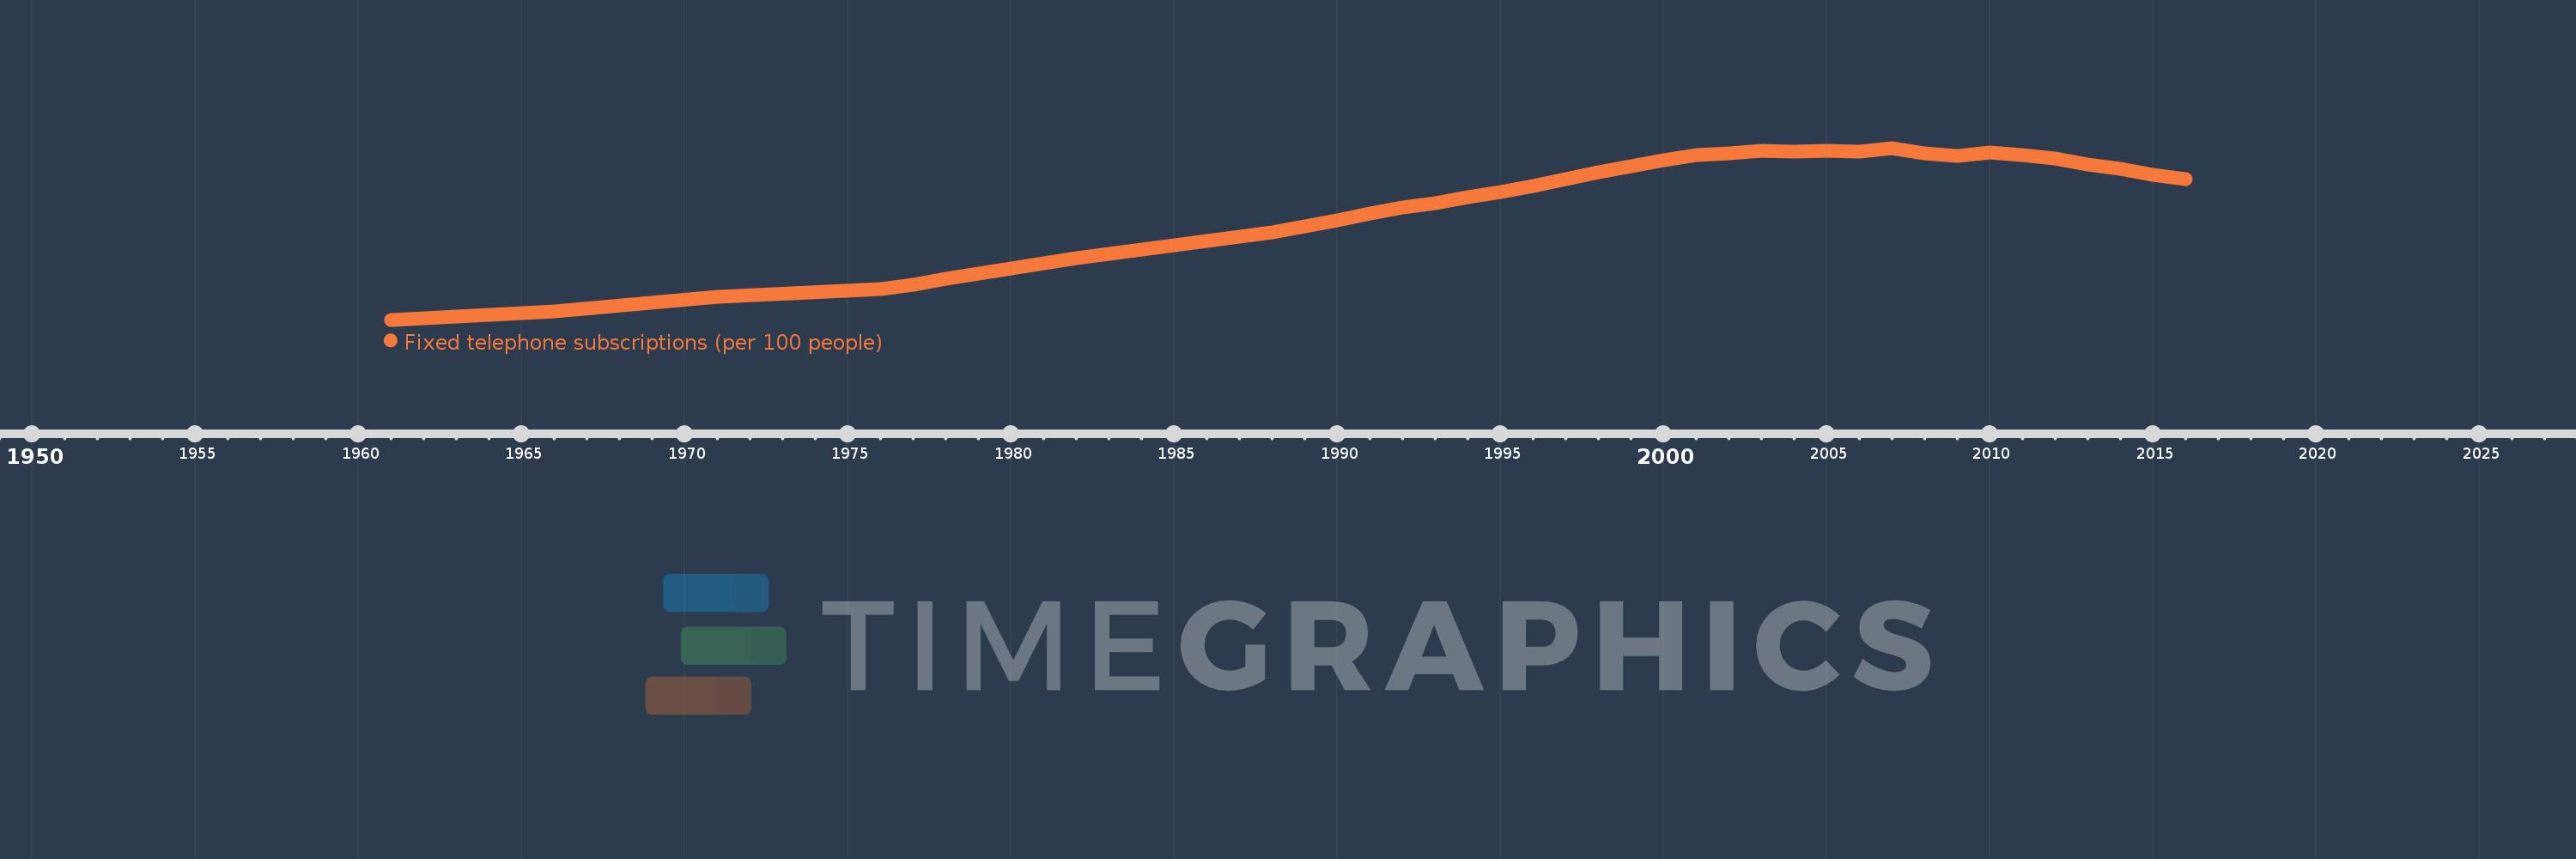
Fixed telephone subscriptions (per 100 people)
2016,2015,2014,2013,2012,2011,2010,2009,2008,2007,2006,2005,2004,2003,2002,2001,2000,1999,1998,1997,1996,1995,1994,1993,1992,1991,1990,1989,1988,1987,1986,1985,1984,1983,1982,1981,1980,1979,1978,1977,1976,1971,1966,1961
This statistics in other country:
AfghanistanAlbaniaAlgeriaAmerican SamoaAndorraAngolaAntigua and BarbudaArab WorldArgentinaArmeniaArubaAustraliaAustriaAzerbaijanBahamas, TheBahrainBangladeshBarbadosBelarusBelgiumBelizeBeninBermudaBhutanBoliviaBosnia and HerzegovinaBotswanaBrazilBritish Virgin IslandsBrunei DarussalamBulgariaBurkina FasoBurundiCabo VerdeCambodiaCameroonCanadaCaribbean small statesCayman IslandsCentral African RepublicCentral Europe and the BalticsChadChileChinaColombiaComorosCongo, Dem. Rep.Congo, Rep.Costa RicaCote d'IvoireCroatiaCubaCuracaoCyprusCzech RepublicDenmarkDjiboutiDominicaDominican RepublicEarly-demographic dividendEast Asia & PacificEast Asia & Pacific (excluding high income)East Asia & Pacific (IDA & IBRD countries)EcuadorEgypt, Arab Rep.El SalvadorEquatorial GuineaEritreaEstoniaEthiopiaEuro areaEurope & Central AsiaEurope & Central Asia (excluding high income)Europe & Central Asia (IDA & IBRD countries)European UnionFaroe IslandsFijiFinlandFragile and conflict affected situationsFranceFrench PolynesiaGabonGambia, TheGeorgiaGermanyGhanaGibraltarGreeceGreenlandGrenadaGuamGuatemalaGuineaGuinea-BissauGuyanaHaitiHeavily indebted poor countries (HIPC)High incomeHondurasHong Kong SAR, ChinaHungaryIBRD onlyIcelandIDA & IBRD totalIDA blendIDA onlyIDA totalIndiaIndonesiaIran, Islamic Rep.IraqIrelandIsraelItalyJamaicaJapanJordanKazakhstanKenyaKiribatiKorea, Dem. People’s Rep.Korea, Rep.KosovoKuwaitKyrgyz RepublicLao PDRLate-demographic dividendLatin America & Caribbean Latin America & Caribbean (excluding high income)Latin America & the Caribbean (IDA & IBRD countries)LatviaLeast developed countries: UN classificationLebanonLesothoLiberiaLibyaLiechtensteinLithuaniaLow & middle incomeLow incomeLower middle incomeLuxembourgMacao SAR, ChinaMacedonia, FYRMadagascarMalawiMalaysiaMaldivesMaliMaltaMarshall IslandsMauritaniaMauritiusMexicoMicronesia, Fed. Sts.Middle East & North AfricaMiddle East & North Africa (excluding high income)Middle East & North Africa (IDA & IBRD countries)Middle incomeMoldovaMonacoMongoliaMontenegroMoroccoMozambiqueMyanmarNamibiaNauruNepalNetherlandsNew CaledoniaNew ZealandNicaraguaNigerNigeriaNorth AmericaNorthern Mariana IslandsNorwayOECD membersOmanOther small statesPacific island small statesPakistanPalauPanamaPapua New GuineaParaguayPeruPhilippinesPolandPortugalPost-demographic dividendPre-demographic dividendPuerto RicoQatarRomaniaRussian FederationRwandaSamoaSan MarinoSao Tome and PrincipeSaudi ArabiaSenegalSerbiaSeychellesSierra LeoneSingaporeSlovak RepublicSloveniaSmall statesSolomon IslandsSomaliaSouth AfricaSouth AsiaSouth Asia (IDA & IBRD)South SudanSpainSri LankaSt. Kitts and NevisSt. LuciaSt. Vincent and the GrenadinesSub-Saharan Africa Sub-Saharan Africa (excluding high income)Sub-Saharan Africa (IDA & IBRD countries)SudanSurinameSwazilandSwedenSwitzerlandSyrian Arab RepublicTajikistanTanzaniaThailandTimor-LesteTogoTongaTrinidad and TobagoTunisiaTurkeyTurkmenistanTurks and Caicos IslandsTuvaluUgandaUkraineUnited Arab EmiratesUnited KingdomUnited StatesUpper middle incomeUruguayUzbekistanVanuatuVenezuela, RBVietnamVirgin Islands (U.S.)West Bank and GazaWorldYemen, Rep.ZambiaZimbabwe Timeline:
This timeline shows a graph from 1961 to 2016 of Europe & Central Asia. No data until 1960. Number of actual observations by date: 44.
Source name:
World Development Indicators
Source organization:
International Telecommunication Union, World Telecommunication/ICT Development Report and database.
Categories, topics:
Infrastructure
Last updated:
apr 23, 2017
Indicators value changes by year
Maximum:
38.881
jan 1, 2007
At the date of observation
Value
Absolute change
Change from previous value
jan 1, 1961
5.452
+5.452
0.0%
jan 1, 1966
7.087
+1.635
30.0%
jan 1, 1971
9.839
+2.752
38.84%
jan 1, 1976
11.417
+1.578
16.04%
jan 1, 1977
12.299
+0.881
7.72%
jan 1, 1978
13.399
+1.1
8.94%
jan 1, 1979
14.492
+1.094
8.16%
jan 1, 1980
15.43
+0.938
6.47%
jan 1, 1981
16.418
+0.987
6.4%
jan 1, 1982
17.434
+1.017
6.19%
jan 1, 1983
18.256
+0.821
4.71%
jan 1, 1984
19.078
+0.823
4.51%
jan 1, 1985
19.926
+0.848
4.44%
jan 1, 1986
20.714
+0.788
3.95%
jan 1, 1987
21.56
+0.846
4.08%
jan 1, 1988
22.492
+0.932
4.33%
jan 1, 1989
23.586
+1.093
4.86%
jan 1, 1990
24.756
+1.17
4.96%
jan 1, 1991
26.08
+1.324
5.35%
jan 1, 1992
27.236
+1.156
4.43%
jan 1, 1993
28.204
+0.967
3.55%
jan 1, 1994
29.259
+1.055
3.74%
jan 1, 1995
30.286
+1.028
3.51%
jan 1, 1996
31.543
+1.257
4.15%
jan 1, 1997
32.811
+1.268
4.02%
jan 1, 1998
34.232
+1.421
4.33%
jan 1, 1999
35.368
+1.136
3.32%
jan 1, 2000
36.465
+1.097
3.1%
jan 1, 2001
37.51
+1.045
2.87%
jan 1, 2002
37.855
+0.346
0.92%
jan 1, 2003
38.262
+0.407
1.07%
jan 1, 2004
38.212
-0.05
-0.13%
jan 1, 2005
38.373
+0.161
0.42%
jan 1, 2006
38.182
-0.191
-0.5%
jan 1, 2007
38.881
+0.699
1.83%
jan 1, 2008
37.837
-1.044
-2.68%
jan 1, 2009
37.336
-0.502
-1.33%
jan 1, 2010
38.031
+0.696
1.86%
jan 1, 2011
37.477
-0.555
-1.46%
jan 1, 2012
36.769
-0.708
-1.89%
jan 1, 2013
35.646
-1.123
-3.05%
jan 1, 2014
34.76
-0.886
-2.49%
jan 1, 2015
33.714
-1.045
-3.01%
jan 1, 2016
32.735
-0.979
-2.9%
Ranking of countries by current statistics by years


Comments: