29
/
en
AIzaSyAYiBZKx7MnpbEhh9jyipgxe19OcubqV5w
April 1, 2024
79426
Barbados
BRB
true
2
1
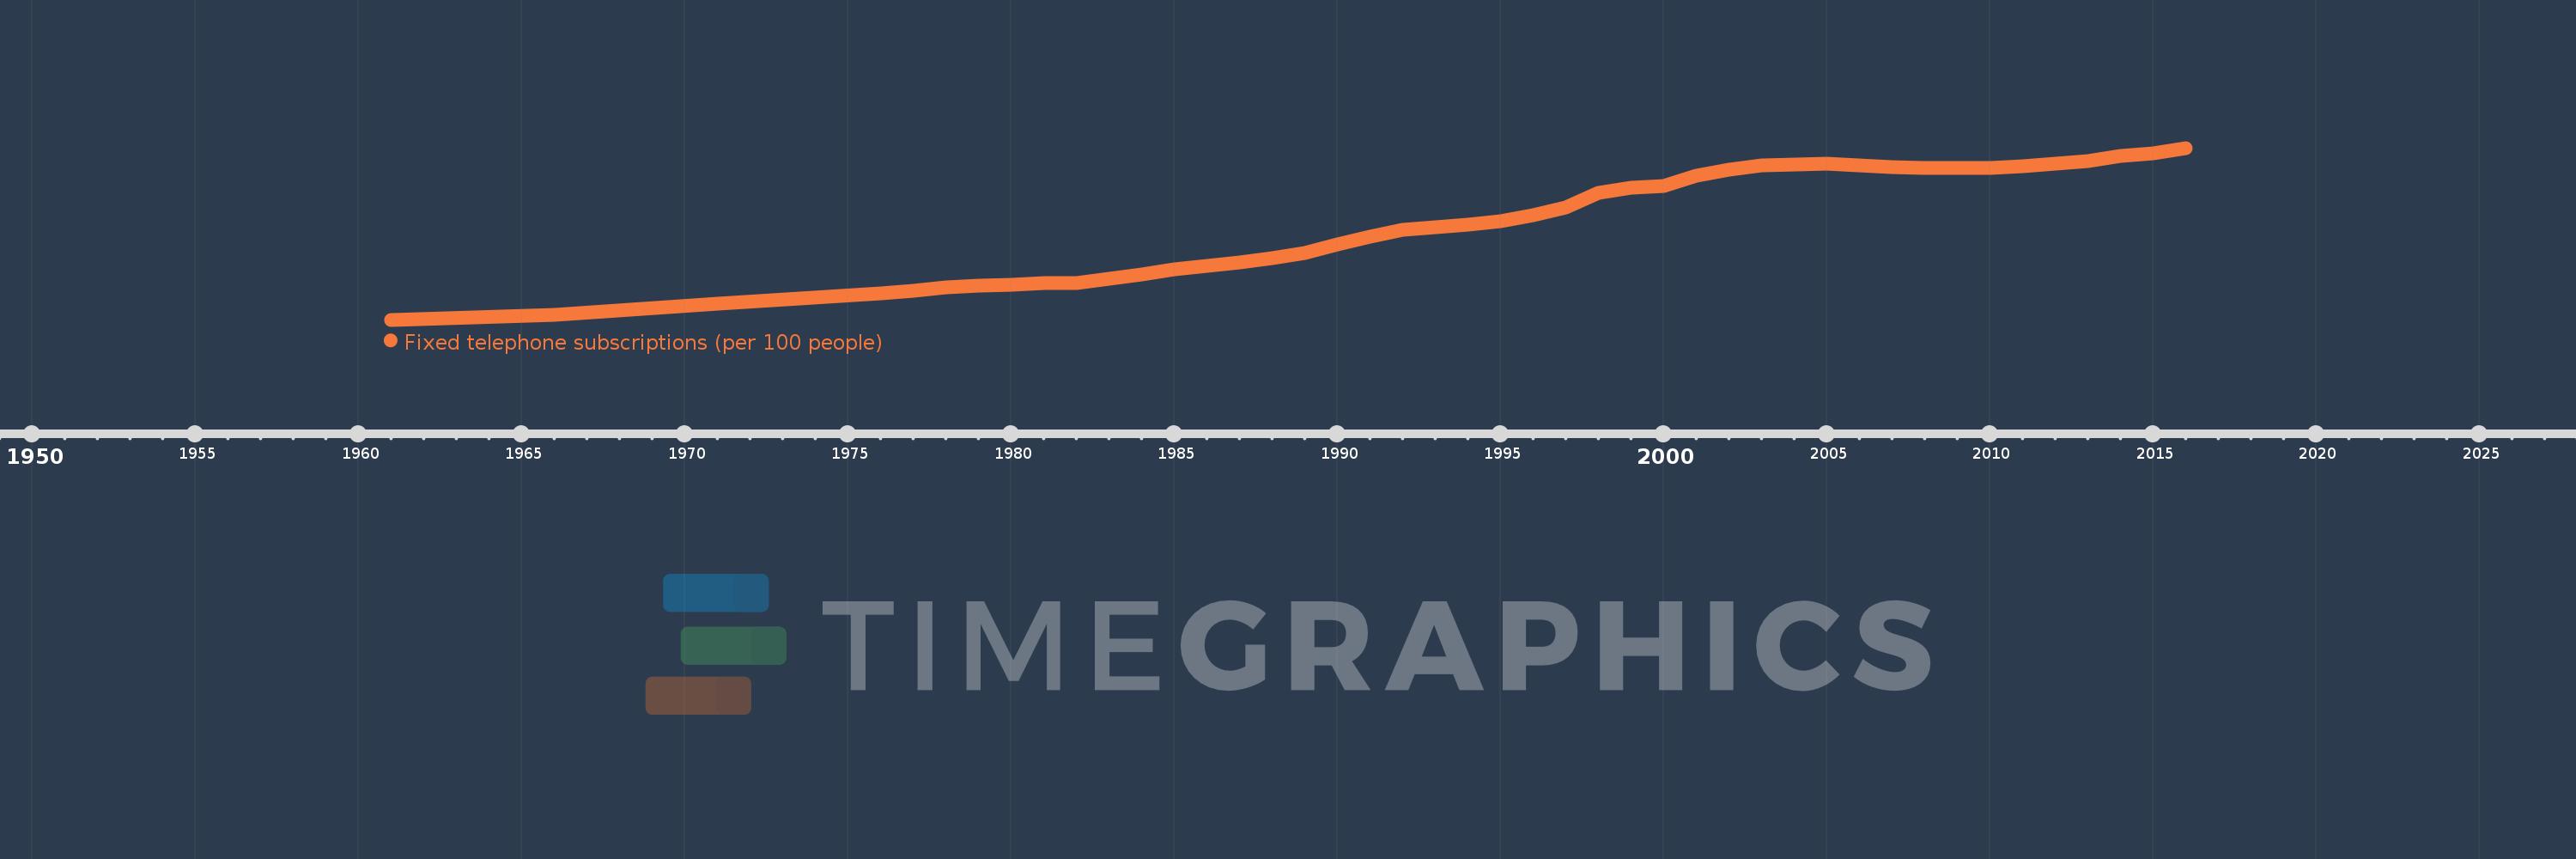
Fixed telephone subscriptions (per 100 people)
2016,2015,2014,2013,2012,2011,2010,2009,2008,2007,2006,2005,2004,2003,2002,2001,2000,1999,1998,1997,1996,1995,1994,1993,1992,1991,1990,1989,1988,1987,1986,1985,1984,1983,1982,1981,1980,1979,1978,1977,1976,1971,1966,1961
This statistics in other country:
AfghanistanAlbaniaAlgeriaAmerican SamoaAndorraAngolaAntigua and BarbudaArab WorldArgentinaArmeniaArubaAustraliaAustriaAzerbaijanBahamas, TheBahrainBangladeshBarbadosBelarusBelgiumBelizeBeninBermudaBhutanBoliviaBosnia and HerzegovinaBotswanaBrazilBritish Virgin IslandsBrunei DarussalamBulgariaBurkina FasoBurundiCabo VerdeCambodiaCameroonCanadaCaribbean small statesCayman IslandsCentral African RepublicCentral Europe and the BalticsChadChileChinaColombiaComorosCongo, Dem. Rep.Congo, Rep.Costa RicaCote d'IvoireCroatiaCubaCuracaoCyprusCzech RepublicDenmarkDjiboutiDominicaDominican RepublicEarly-demographic dividendEast Asia & PacificEast Asia & Pacific (excluding high income)East Asia & Pacific (IDA & IBRD countries)EcuadorEgypt, Arab Rep.El SalvadorEquatorial GuineaEritreaEstoniaEthiopiaEuro areaEurope & Central AsiaEurope & Central Asia (excluding high income)Europe & Central Asia (IDA & IBRD countries)European UnionFaroe IslandsFijiFinlandFragile and conflict affected situationsFranceFrench PolynesiaGabonGambia, TheGeorgiaGermanyGhanaGibraltarGreeceGreenlandGrenadaGuamGuatemalaGuineaGuinea-BissauGuyanaHaitiHeavily indebted poor countries (HIPC)High incomeHondurasHong Kong SAR, ChinaHungaryIBRD onlyIcelandIDA & IBRD totalIDA blendIDA onlyIDA totalIndiaIndonesiaIran, Islamic Rep.IraqIrelandIsraelItalyJamaicaJapanJordanKazakhstanKenyaKiribatiKorea, Dem. People’s Rep.Korea, Rep.KosovoKuwaitKyrgyz RepublicLao PDRLate-demographic dividendLatin America & Caribbean Latin America & Caribbean (excluding high income)Latin America & the Caribbean (IDA & IBRD countries)LatviaLeast developed countries: UN classificationLebanonLesothoLiberiaLibyaLiechtensteinLithuaniaLow & middle incomeLow incomeLower middle incomeLuxembourgMacao SAR, ChinaMacedonia, FYRMadagascarMalawiMalaysiaMaldivesMaliMaltaMarshall IslandsMauritaniaMauritiusMexicoMicronesia, Fed. Sts.Middle East & North AfricaMiddle East & North Africa (excluding high income)Middle East & North Africa (IDA & IBRD countries)Middle incomeMoldovaMonacoMongoliaMontenegroMoroccoMozambiqueMyanmarNamibiaNauruNepalNetherlandsNew CaledoniaNew ZealandNicaraguaNigerNigeriaNorth AmericaNorthern Mariana IslandsNorwayOECD membersOmanOther small statesPacific island small statesPakistanPalauPanamaPapua New GuineaParaguayPeruPhilippinesPolandPortugalPost-demographic dividendPre-demographic dividendPuerto RicoQatarRomaniaRussian FederationRwandaSamoaSan MarinoSao Tome and PrincipeSaudi ArabiaSenegalSerbiaSeychellesSierra LeoneSingaporeSlovak RepublicSloveniaSmall statesSolomon IslandsSomaliaSouth AfricaSouth AsiaSouth Asia (IDA & IBRD)South SudanSpainSri LankaSt. Kitts and NevisSt. LuciaSt. Vincent and the GrenadinesSub-Saharan Africa Sub-Saharan Africa (excluding high income)Sub-Saharan Africa (IDA & IBRD countries)SudanSurinameSwazilandSwedenSwitzerlandSyrian Arab RepublicTajikistanTanzaniaThailandTimor-LesteTogoTongaTrinidad and TobagoTunisiaTurkeyTurkmenistanTurks and Caicos IslandsTuvaluUgandaUkraineUnited Arab EmiratesUnited KingdomUnited StatesUpper middle incomeUruguayUzbekistanVanuatuVenezuela, RBVietnamVirgin Islands (U.S.)West Bank and GazaWorldYemen, Rep.ZambiaZimbabwe Timeline:
This timeline shows a graph from 1961 to 2016 of Barbados. No data until 1960. Number of actual observations by date: 44.
Source name:
World Development Indicators
Source organization:
International Telecommunication Union, World Telecommunication/ICT Development Report and database.
Categories, topics:
Infrastructure
Last updated:
apr 23, 2017
Indicators value changes by year
Maximum:
54.562
jan 1, 2016
At the date of observation
Value
Absolute change
Change from previous value
jan 1, 1961
3.003
+3.003
0.0%
jan 1, 1966
4.59
+1.587
52.85%
jan 1, 1971
7.829
+3.239
70.56%
jan 1, 1976
11.009
+3.18
40.62%
jan 1, 1977
11.748
+0.738
6.71%
jan 1, 1978
12.67
+0.923
7.86%
jan 1, 1979
13.142
+0.472
3.72%
jan 1, 1980
13.61
+0.468
3.56%
jan 1, 1981
13.883
+0.273
2.01%
jan 1, 1982
14.002
+0.119
0.85%
jan 1, 1983
15.228
+1.227
8.76%
jan 1, 1984
16.635
+1.407
9.24%
jan 1, 1985
18.188
+1.553
9.33%
jan 1, 1986
19.063
+0.875
4.81%
jan 1, 1987
20.236
+1.172
6.15%
jan 1, 1988
21.458
+1.222
6.04%
jan 1, 1989
23.102
+1.644
7.66%
jan 1, 1990
25.581
+2.479
10.73%
jan 1, 1991
27.818
+2.236
8.74%
jan 1, 1992
29.971
+2.153
7.74%
jan 1, 1993
30.692
+0.721
2.41%
jan 1, 1994
31.526
+0.834
2.72%
jan 1, 1995
32.532
+1.006
3.19%
jan 1, 1996
34.249
+1.718
5.28%
jan 1, 1997
36.587
+2.338
6.83%
jan 1, 1998
40.988
+4.401
12.03%
jan 1, 1999
42.594
+1.606
3.92%
jan 1, 2000
43.197
+0.604
1.42%
jan 1, 2001
46.346
+3.149
7.29%
jan 1, 2002
48.065
+1.719
3.71%
jan 1, 2003
49.346
+1.281
2.67%
jan 1, 2004
49.475
+0.129
0.26%
jan 1, 2005
49.864
+0.389
0.79%
jan 1, 2006
49.303
-0.561
-1.12%
jan 1, 2007
48.836
-0.467
-0.95%
jan 1, 2008
48.597
-0.239
-0.49%
jan 1, 2009
48.625
+0.029
0.06%
jan 1, 2010
48.637
+0.012
0.02%
jan 1, 2011
49.033
+0.396
0.81%
jan 1, 2012
49.917
+0.884
1.8%
jan 1, 2013
50.617
+0.7
1.4%
jan 1, 2014
52.253
+1.636
3.23%
jan 1, 2015
52.923
+0.67
1.28%
jan 1, 2016
54.562
+1.64
3.1%
Ranking of countries by current statistics by years


Comments: