29
/
en
AIzaSyAYiBZKx7MnpbEhh9jyipgxe19OcubqV5w
April 1, 2024
275665
United Kingdom
GBR
true
2
1
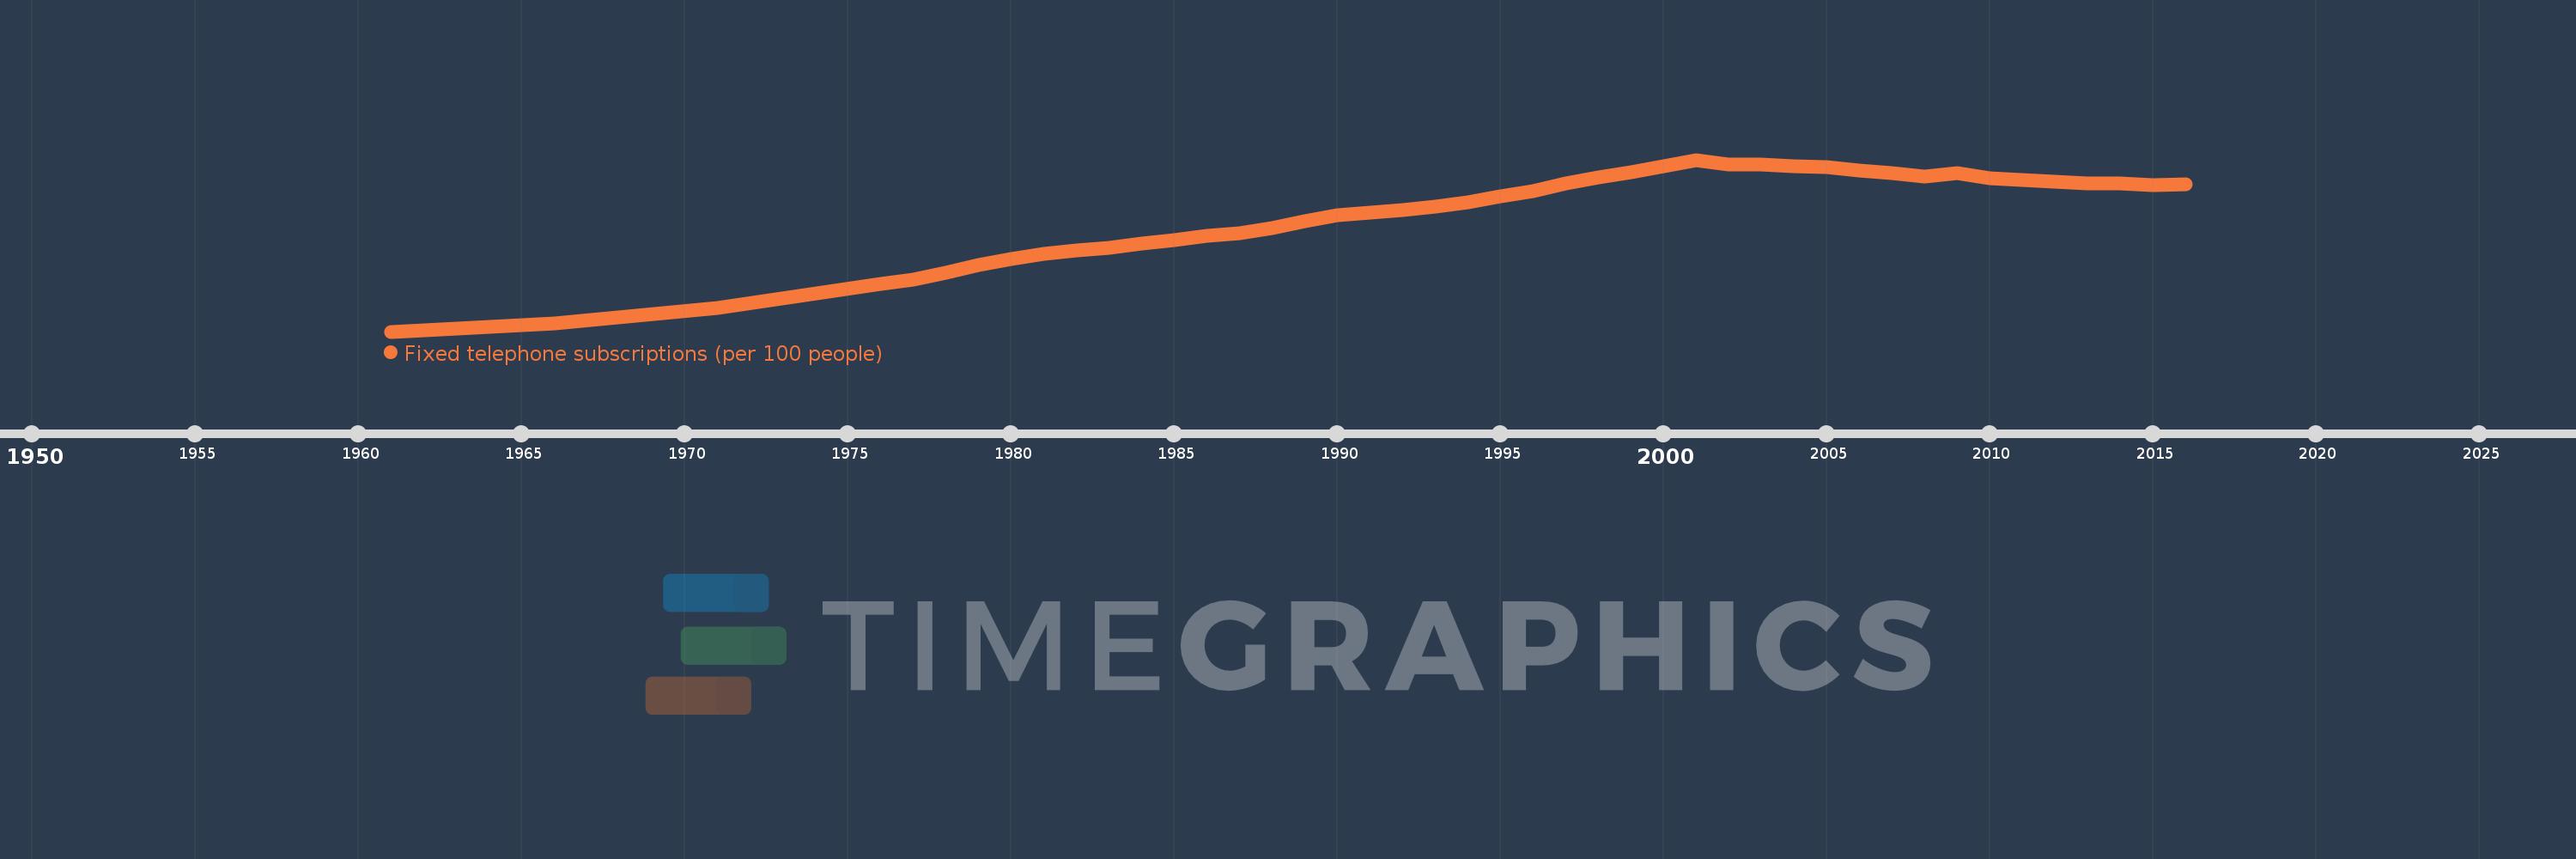
Fixed telephone subscriptions (per 100 people)
2016,2015,2014,2013,2012,2011,2010,2009,2008,2007,2006,2005,2004,2003,2002,2001,2000,1999,1998,1997,1996,1995,1994,1993,1992,1991,1990,1989,1988,1987,1986,1985,1984,1983,1982,1981,1980,1979,1978,1977,1976,1971,1966,1961
This statistics in other country:
AfghanistanAlbaniaAlgeriaAmerican SamoaAndorraAngolaAntigua and BarbudaArab WorldArgentinaArmeniaArubaAustraliaAustriaAzerbaijanBahamas, TheBahrainBangladeshBarbadosBelarusBelgiumBelizeBeninBermudaBhutanBoliviaBosnia and HerzegovinaBotswanaBrazilBritish Virgin IslandsBrunei DarussalamBulgariaBurkina FasoBurundiCabo VerdeCambodiaCameroonCanadaCaribbean small statesCayman IslandsCentral African RepublicCentral Europe and the BalticsChadChileChinaColombiaComorosCongo, Dem. Rep.Congo, Rep.Costa RicaCote d'IvoireCroatiaCubaCuracaoCyprusCzech RepublicDenmarkDjiboutiDominicaDominican RepublicEarly-demographic dividendEast Asia & PacificEast Asia & Pacific (excluding high income)East Asia & Pacific (IDA & IBRD countries)EcuadorEgypt, Arab Rep.El SalvadorEquatorial GuineaEritreaEstoniaEthiopiaEuro areaEurope & Central AsiaEurope & Central Asia (excluding high income)Europe & Central Asia (IDA & IBRD countries)European UnionFaroe IslandsFijiFinlandFragile and conflict affected situationsFranceFrench PolynesiaGabonGambia, TheGeorgiaGermanyGhanaGibraltarGreeceGreenlandGrenadaGuamGuatemalaGuineaGuinea-BissauGuyanaHaitiHeavily indebted poor countries (HIPC)High incomeHondurasHong Kong SAR, ChinaHungaryIBRD onlyIcelandIDA & IBRD totalIDA blendIDA onlyIDA totalIndiaIndonesiaIran, Islamic Rep.IraqIrelandIsraelItalyJamaicaJapanJordanKazakhstanKenyaKiribatiKorea, Dem. People’s Rep.Korea, Rep.KosovoKuwaitKyrgyz RepublicLao PDRLate-demographic dividendLatin America & Caribbean Latin America & Caribbean (excluding high income)Latin America & the Caribbean (IDA & IBRD countries)LatviaLeast developed countries: UN classificationLebanonLesothoLiberiaLibyaLiechtensteinLithuaniaLow & middle incomeLow incomeLower middle incomeLuxembourgMacao SAR, ChinaMacedonia, FYRMadagascarMalawiMalaysiaMaldivesMaliMaltaMarshall IslandsMauritaniaMauritiusMexicoMicronesia, Fed. Sts.Middle East & North AfricaMiddle East & North Africa (excluding high income)Middle East & North Africa (IDA & IBRD countries)Middle incomeMoldovaMonacoMongoliaMontenegroMoroccoMozambiqueMyanmarNamibiaNauruNepalNetherlandsNew CaledoniaNew ZealandNicaraguaNigerNigeriaNorth AmericaNorthern Mariana IslandsNorwayOECD membersOmanOther small statesPacific island small statesPakistanPalauPanamaPapua New GuineaParaguayPeruPhilippinesPolandPortugalPost-demographic dividendPre-demographic dividendPuerto RicoQatarRomaniaRussian FederationRwandaSamoaSan MarinoSao Tome and PrincipeSaudi ArabiaSenegalSerbiaSeychellesSierra LeoneSingaporeSlovak RepublicSloveniaSmall statesSolomon IslandsSomaliaSouth AfricaSouth AsiaSouth Asia (IDA & IBRD)South SudanSpainSri LankaSt. Kitts and NevisSt. LuciaSt. Vincent and the GrenadinesSub-Saharan Africa Sub-Saharan Africa (excluding high income)Sub-Saharan Africa (IDA & IBRD countries)SudanSurinameSwazilandSwedenSwitzerlandSyrian Arab RepublicTajikistanTanzaniaThailandTimor-LesteTogoTongaTrinidad and TobagoTunisiaTurkeyTurkmenistanTurks and Caicos IslandsTuvaluUgandaUkraineUnited Arab EmiratesUnited KingdomUnited StatesUpper middle incomeUruguayUzbekistanVanuatuVenezuela, RBVietnamVirgin Islands (U.S.)West Bank and GazaWorldYemen, Rep.ZambiaZimbabwe Timeline:
This timeline shows a graph from 1961 to 2016 of United Kingdom. No data until 1960. Number of actual observations by date: 44.
Source name:
World Development Indicators
Source organization:
International Telecommunication Union, World Telecommunication/ICT Development Report and database.
Categories, topics:
Infrastructure
Last updated:
apr 23, 2017
Indicators value changes by year
Maximum:
59.758
jan 1, 2001
At the date of observation
Value
Absolute change
Change from previous value
jan 1, 1961
9.586
+9.586
0.0%
jan 1, 1966
12.022
+2.436
25.41%
jan 1, 1971
16.557
+4.535
37.72%
jan 1, 1976
23.527
+6.97
42.1%
jan 1, 1977
24.808
+1.281
5.45%
jan 1, 1978
26.772
+1.964
7.92%
jan 1, 1979
29.058
+2.286
8.54%
jan 1, 1980
30.776
+1.719
5.92%
jan 1, 1981
32.256
+1.479
4.81%
jan 1, 1982
33.377
+1.121
3.48%
jan 1, 1983
34.151
+0.774
2.32%
jan 1, 1984
35.245
+1.094
3.2%
jan 1, 1985
36.405
+1.16
3.29%
jan 1, 1986
37.467
+1.061
2.92%
jan 1, 1987
38.371
+0.905
2.41%
jan 1, 1988
39.934
+1.562
4.07%
jan 1, 1989
41.72
+1.786
4.47%
jan 1, 1990
43.458
+1.738
4.17%
jan 1, 1991
44.338
+0.88
2.02%
jan 1, 1992
45.167
+0.828
1.87%
jan 1, 1993
46.095
+0.928
2.06%
jan 1, 1994
47.397
+1.302
2.82%
jan 1, 1995
49.035
+1.638
3.45%
jan 1, 1996
50.712
+1.677
3.42%
jan 1, 1997
52.739
+2.028
4.0%
jan 1, 1998
54.637
+1.898
3.6%
jan 1, 1999
56.085
+1.448
2.65%
jan 1, 2000
57.923
+1.838
3.28%
jan 1, 2001
59.758
+1.835
3.17%
jan 1, 2002
58.426
-1.331
-2.23%
jan 1, 2003
58.449
+0.023
0.04%
jan 1, 2004
57.875
-0.574
-0.98%
jan 1, 2005
57.643
-0.232
-0.4%
jan 1, 2006
56.506
-1.136
-1.97%
jan 1, 2007
55.836
-0.67
-1.19%
jan 1, 2008
54.883
-0.954
-1.71%
jan 1, 2009
55.748
+0.865
1.58%
jan 1, 2010
54.304
-1.444
-2.59%
jan 1, 2011
53.828
-0.476
-0.88%
jan 1, 2012
53.266
-0.562
-1.04%
jan 1, 2013
52.876
-0.39
-0.73%
jan 1, 2014
52.876
0.0
0.0%
jan 1, 2015
52.352
-0.524
-0.99%
jan 1, 2016
52.649
+0.296
0.57%
Ranking of countries by current statistics by years


Comments: