29
/
en
AIzaSyAYiBZKx7MnpbEhh9jyipgxe19OcubqV5w
April 1, 2024
271415
Tuvalu
TUV
true
2
1
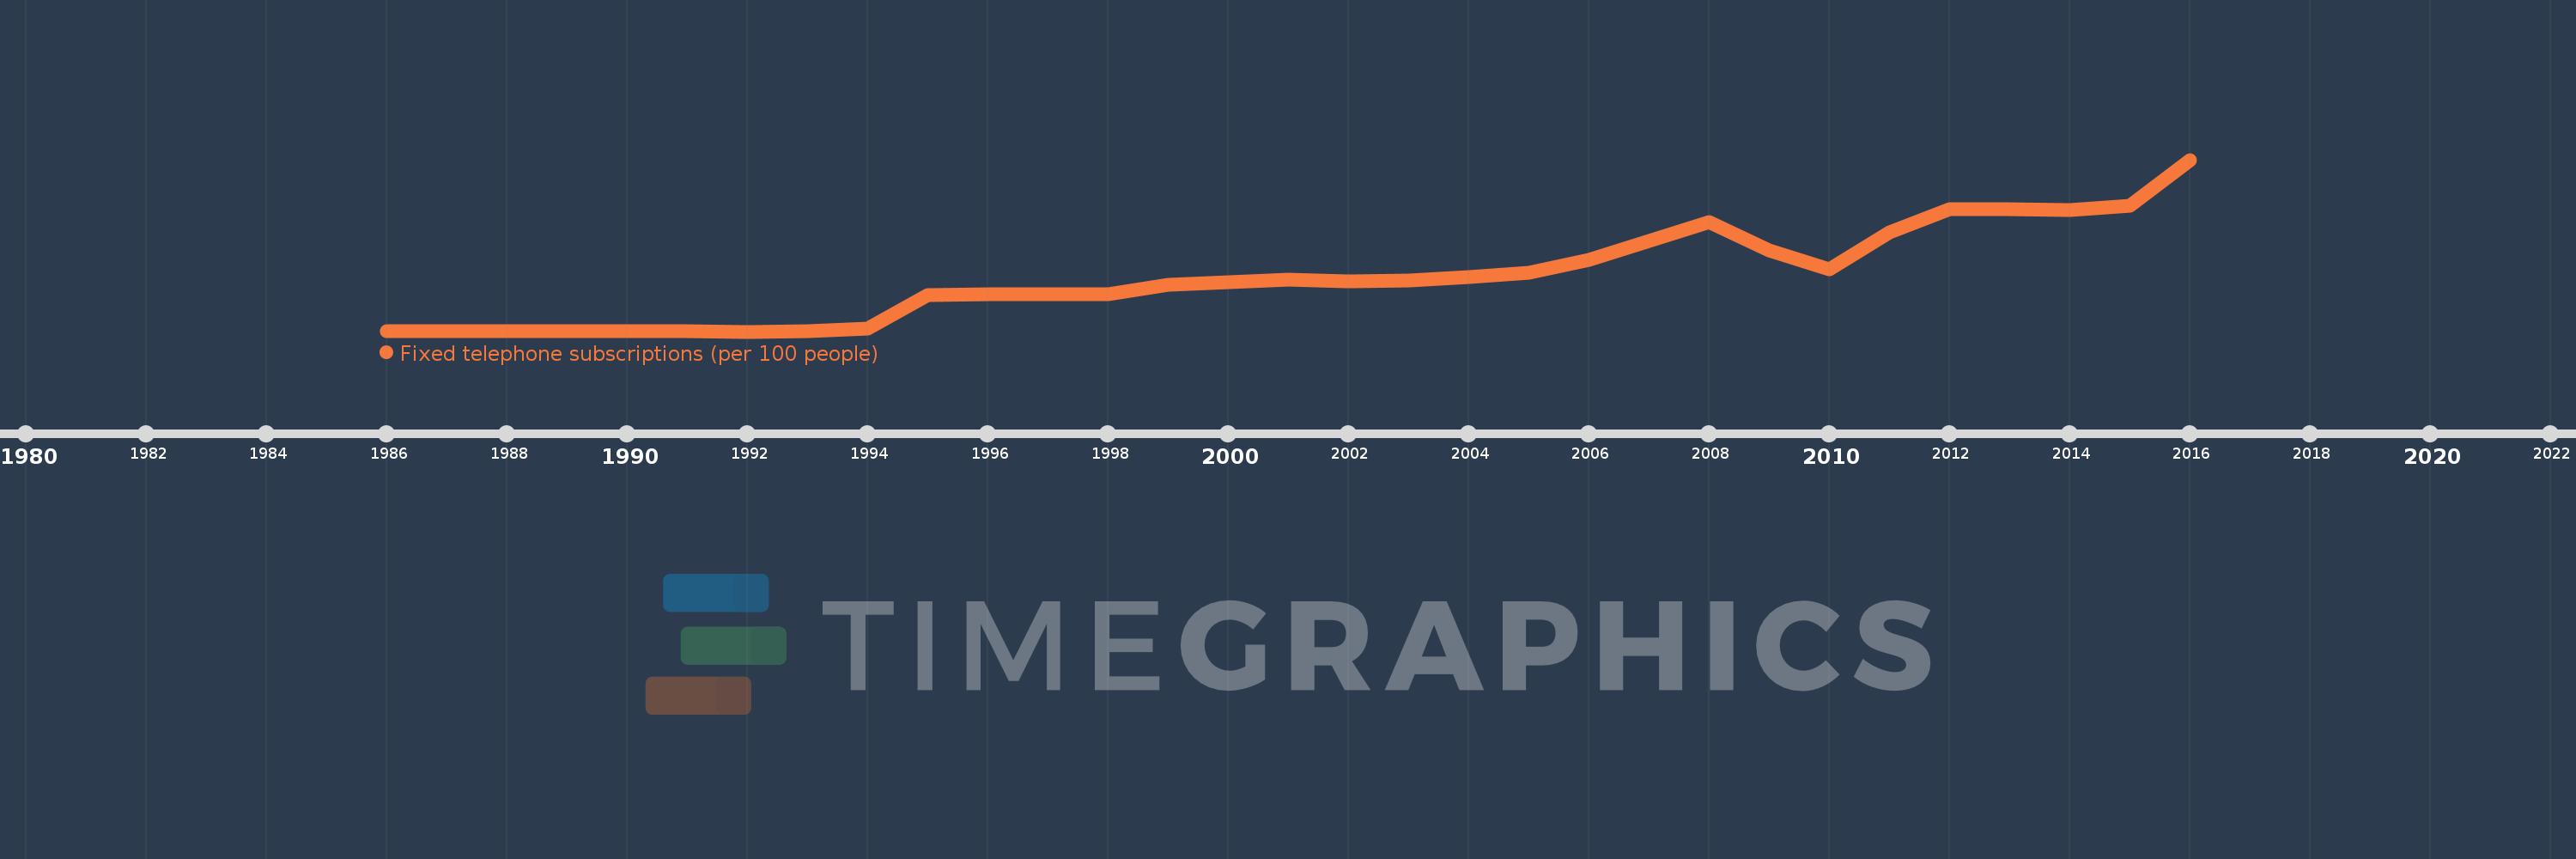
Fixed telephone subscriptions (per 100 people)
2016,2015,2014,2013,2012,2011,2010,2009,2008,2007,2006,2005,2004,2003,2002,2001,2000,1999,1998,1997,1996,1995,1994,1993,1992,1991,1990,1989,1988,1987,1986
This statistics in other country:
AfghanistanAlbaniaAlgeriaAmerican SamoaAndorraAngolaAntigua and BarbudaArab WorldArgentinaArmeniaArubaAustraliaAustriaAzerbaijanBahamas, TheBahrainBangladeshBarbadosBelarusBelgiumBelizeBeninBermudaBhutanBoliviaBosnia and HerzegovinaBotswanaBrazilBritish Virgin IslandsBrunei DarussalamBulgariaBurkina FasoBurundiCabo VerdeCambodiaCameroonCanadaCaribbean small statesCayman IslandsCentral African RepublicCentral Europe and the BalticsChadChileChinaColombiaComorosCongo, Dem. Rep.Congo, Rep.Costa RicaCote d'IvoireCroatiaCubaCuracaoCyprusCzech RepublicDenmarkDjiboutiDominicaDominican RepublicEarly-demographic dividendEast Asia & PacificEast Asia & Pacific (excluding high income)East Asia & Pacific (IDA & IBRD countries)EcuadorEgypt, Arab Rep.El SalvadorEquatorial GuineaEritreaEstoniaEthiopiaEuro areaEurope & Central AsiaEurope & Central Asia (excluding high income)Europe & Central Asia (IDA & IBRD countries)European UnionFaroe IslandsFijiFinlandFragile and conflict affected situationsFranceFrench PolynesiaGabonGambia, TheGeorgiaGermanyGhanaGibraltarGreeceGreenlandGrenadaGuamGuatemalaGuineaGuinea-BissauGuyanaHaitiHeavily indebted poor countries (HIPC)High incomeHondurasHong Kong SAR, ChinaHungaryIBRD onlyIcelandIDA & IBRD totalIDA blendIDA onlyIDA totalIndiaIndonesiaIran, Islamic Rep.IraqIrelandIsraelItalyJamaicaJapanJordanKazakhstanKenyaKiribatiKorea, Dem. People’s Rep.Korea, Rep.KosovoKuwaitKyrgyz RepublicLao PDRLate-demographic dividendLatin America & Caribbean Latin America & Caribbean (excluding high income)Latin America & the Caribbean (IDA & IBRD countries)LatviaLeast developed countries: UN classificationLebanonLesothoLiberiaLibyaLiechtensteinLithuaniaLow & middle incomeLow incomeLower middle incomeLuxembourgMacao SAR, ChinaMacedonia, FYRMadagascarMalawiMalaysiaMaldivesMaliMaltaMarshall IslandsMauritaniaMauritiusMexicoMicronesia, Fed. Sts.Middle East & North AfricaMiddle East & North Africa (excluding high income)Middle East & North Africa (IDA & IBRD countries)Middle incomeMoldovaMonacoMongoliaMontenegroMoroccoMozambiqueMyanmarNamibiaNauruNepalNetherlandsNew CaledoniaNew ZealandNicaraguaNigerNigeriaNorth AmericaNorthern Mariana IslandsNorwayOECD membersOmanOther small statesPacific island small statesPakistanPalauPanamaPapua New GuineaParaguayPeruPhilippinesPolandPortugalPost-demographic dividendPre-demographic dividendPuerto RicoQatarRomaniaRussian FederationRwandaSamoaSan MarinoSao Tome and PrincipeSaudi ArabiaSenegalSerbiaSeychellesSierra LeoneSingaporeSlovak RepublicSloveniaSmall statesSolomon IslandsSomaliaSouth AfricaSouth AsiaSouth Asia (IDA & IBRD)South SudanSpainSri LankaSt. Kitts and NevisSt. LuciaSt. Vincent and the GrenadinesSub-Saharan Africa Sub-Saharan Africa (excluding high income)Sub-Saharan Africa (IDA & IBRD countries)SudanSurinameSwazilandSwedenSwitzerlandSyrian Arab RepublicTajikistanTanzaniaThailandTimor-LesteTogoTongaTrinidad and TobagoTunisiaTurkeyTurkmenistanTurks and Caicos IslandsTuvaluUgandaUkraineUnited Arab EmiratesUnited KingdomUnited StatesUpper middle incomeUruguayUzbekistanVanuatuVenezuela, RBVietnamVirgin Islands (U.S.)West Bank and GazaWorldYemen, Rep.ZambiaZimbabwe Timeline:
This timeline shows a graph from 1986 to 2016 of Tuvalu. No data until 1985. Number of actual observations by date: 31.
Source name:
World Development Indicators
Source organization:
International Telecommunication Union, World Telecommunication/ICT Development Report and database.
Categories, topics:
Infrastructure
Last updated:
apr 23, 2017
Indicators value changes by year
Maximum:
20.169
jan 1, 2016
At the date of observation
Value
Absolute change
Change from previous value
jan 1, 1986
1.388
+1.388
0.0%
jan 1, 1987
1.373
-0.015
-1.06%
jan 1, 1988
1.36
-0.012
-0.91%
jan 1, 1989
1.35
-0.01
-0.76%
jan 1, 1990
1.341
-0.009
-0.67%
jan 1, 1991
1.333
-0.008
-0.61%
jan 1, 1992
1.325
-0.008
-0.57%
jan 1, 1993
1.384
+0.059
4.46%
jan 1, 1994
1.64
+0.256
18.46%
jan 1, 1995
5.366
+3.726
227.24%
jan 1, 1996
5.462
+0.097
1.8%
jan 1, 1997
5.44
-0.022
-0.4%
jan 1, 1998
5.464
+0.023
0.43%
jan 1, 1999
6.428
+0.965
17.65%
jan 1, 2000
6.721
+0.293
4.55%
jan 1, 2001
7.007
+0.286
4.26%
jan 1, 2002
6.863
-0.144
-2.06%
jan 1, 2003
6.925
+0.062
0.91%
jan 1, 2004
7.299
+0.374
5.4%
jan 1, 2005
7.775
+0.476
6.52%
jan 1, 2006
9.181
+1.406
18.08%
jan 1, 2007
11.303
+2.122
23.11%
jan 1, 2008
13.314
+2.011
17.79%
jan 1, 2009
10.217
-3.098
-23.27%
jan 1, 2010
8.157
-2.06
-20.16%
jan 1, 2011
12.211
+4.055
49.71%
jan 1, 2012
14.73
+2.519
20.62%
jan 1, 2013
14.706
-0.024
-0.16%
jan 1, 2014
14.682
-0.024
-0.16%
jan 1, 2015
15.161
+0.479
3.26%
jan 1, 2016
20.169
+5.009
33.04%
Ranking of countries by current statistics by years


Comments: