29
/
en
AIzaSyAYiBZKx7MnpbEhh9jyipgxe19OcubqV5w
April 1, 2024
131445
Faroe Islands
FRO
true
2
1
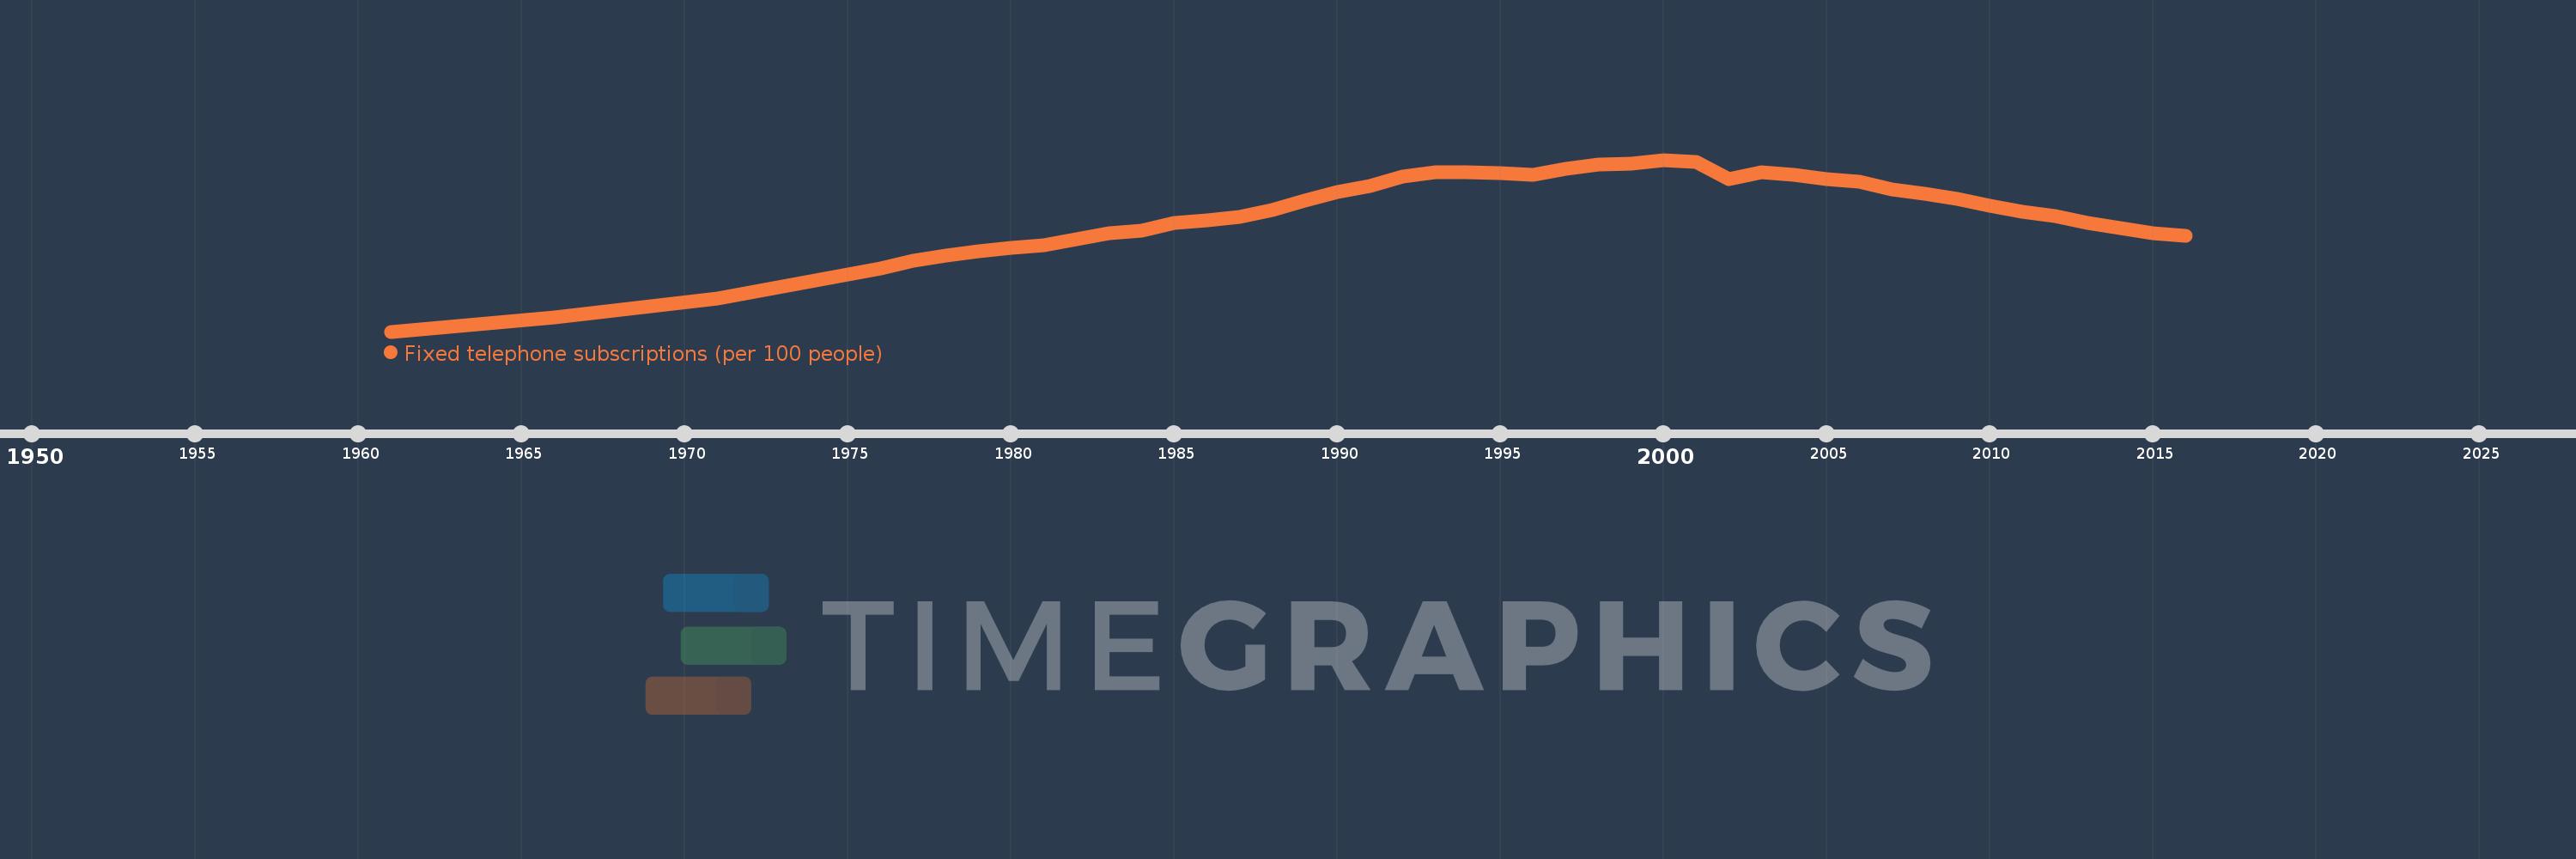
Fixed telephone subscriptions (per 100 people)
2016,2015,2014,2013,2012,2011,2010,2009,2008,2007,2006,2005,2004,2003,2002,2001,2000,1999,1998,1997,1996,1995,1994,1993,1992,1991,1990,1989,1988,1987,1986,1985,1984,1983,1982,1981,1980,1979,1978,1977,1976,1971,1966,1961
This statistics in other country:
AfghanistanAlbaniaAlgeriaAmerican SamoaAndorraAngolaAntigua and BarbudaArab WorldArgentinaArmeniaArubaAustraliaAustriaAzerbaijanBahamas, TheBahrainBangladeshBarbadosBelarusBelgiumBelizeBeninBermudaBhutanBoliviaBosnia and HerzegovinaBotswanaBrazilBritish Virgin IslandsBrunei DarussalamBulgariaBurkina FasoBurundiCabo VerdeCambodiaCameroonCanadaCaribbean small statesCayman IslandsCentral African RepublicCentral Europe and the BalticsChadChileChinaColombiaComorosCongo, Dem. Rep.Congo, Rep.Costa RicaCote d'IvoireCroatiaCubaCuracaoCyprusCzech RepublicDenmarkDjiboutiDominicaDominican RepublicEarly-demographic dividendEast Asia & PacificEast Asia & Pacific (excluding high income)East Asia & Pacific (IDA & IBRD countries)EcuadorEgypt, Arab Rep.El SalvadorEquatorial GuineaEritreaEstoniaEthiopiaEuro areaEurope & Central AsiaEurope & Central Asia (excluding high income)Europe & Central Asia (IDA & IBRD countries)European UnionFaroe IslandsFijiFinlandFragile and conflict affected situationsFranceFrench PolynesiaGabonGambia, TheGeorgiaGermanyGhanaGibraltarGreeceGreenlandGrenadaGuamGuatemalaGuineaGuinea-BissauGuyanaHaitiHeavily indebted poor countries (HIPC)High incomeHondurasHong Kong SAR, ChinaHungaryIBRD onlyIcelandIDA & IBRD totalIDA blendIDA onlyIDA totalIndiaIndonesiaIran, Islamic Rep.IraqIrelandIsraelItalyJamaicaJapanJordanKazakhstanKenyaKiribatiKorea, Dem. People’s Rep.Korea, Rep.KosovoKuwaitKyrgyz RepublicLao PDRLate-demographic dividendLatin America & Caribbean Latin America & Caribbean (excluding high income)Latin America & the Caribbean (IDA & IBRD countries)LatviaLeast developed countries: UN classificationLebanonLesothoLiberiaLibyaLiechtensteinLithuaniaLow & middle incomeLow incomeLower middle incomeLuxembourgMacao SAR, ChinaMacedonia, FYRMadagascarMalawiMalaysiaMaldivesMaliMaltaMarshall IslandsMauritaniaMauritiusMexicoMicronesia, Fed. Sts.Middle East & North AfricaMiddle East & North Africa (excluding high income)Middle East & North Africa (IDA & IBRD countries)Middle incomeMoldovaMonacoMongoliaMontenegroMoroccoMozambiqueMyanmarNamibiaNauruNepalNetherlandsNew CaledoniaNew ZealandNicaraguaNigerNigeriaNorth AmericaNorthern Mariana IslandsNorwayOECD membersOmanOther small statesPacific island small statesPakistanPalauPanamaPapua New GuineaParaguayPeruPhilippinesPolandPortugalPost-demographic dividendPre-demographic dividendPuerto RicoQatarRomaniaRussian FederationRwandaSamoaSan MarinoSao Tome and PrincipeSaudi ArabiaSenegalSerbiaSeychellesSierra LeoneSingaporeSlovak RepublicSloveniaSmall statesSolomon IslandsSomaliaSouth AfricaSouth AsiaSouth Asia (IDA & IBRD)South SudanSpainSri LankaSt. Kitts and NevisSt. LuciaSt. Vincent and the GrenadinesSub-Saharan Africa Sub-Saharan Africa (excluding high income)Sub-Saharan Africa (IDA & IBRD countries)SudanSurinameSwazilandSwedenSwitzerlandSyrian Arab RepublicTajikistanTanzaniaThailandTimor-LesteTogoTongaTrinidad and TobagoTunisiaTurkeyTurkmenistanTurks and Caicos IslandsTuvaluUgandaUkraineUnited Arab EmiratesUnited KingdomUnited StatesUpper middle incomeUruguayUzbekistanVanuatuVenezuela, RBVietnamVirgin Islands (U.S.)West Bank and GazaWorldYemen, Rep.ZambiaZimbabwe Timeline:
This timeline shows a graph from 1961 to 2016 of Faroe Islands. No data until 1960. Number of actual observations by date: 44.
Source name:
World Development Indicators
Source organization:
International Telecommunication Union, World Telecommunication/ICT Development Report and database.
Categories, topics:
Infrastructure
Last updated:
apr 23, 2017
Indicators value changes by year
Maximum:
54.274
jan 1, 2000
At the date of observation
Value
Absolute change
Change from previous value
jan 1, 1961
9.362
+9.362
0.0%
jan 1, 1966
13.104
+3.742
39.97%
jan 1, 1971
17.908
+4.804
36.66%
jan 1, 1976
25.979
+8.071
45.07%
jan 1, 1977
27.823
+1.844
7.1%
jan 1, 1978
29.172
+1.35
4.85%
jan 1, 1979
30.298
+1.126
3.86%
jan 1, 1980
31.268
+0.97
3.2%
jan 1, 1981
32.041
+0.773
2.47%
jan 1, 1982
33.607
+1.566
4.89%
jan 1, 1983
35.182
+1.575
4.69%
jan 1, 1984
35.649
+0.467
1.33%
jan 1, 1985
37.667
+2.018
5.66%
jan 1, 1986
38.554
+0.887
2.36%
jan 1, 1987
39.378
+0.824
2.14%
jan 1, 1988
41.194
+1.816
4.61%
jan 1, 1989
43.558
+2.364
5.74%
jan 1, 1990
45.843
+2.285
5.25%
jan 1, 1991
47.521
+1.678
3.66%
jan 1, 1992
49.933
+2.411
5.07%
jan 1, 1993
50.968
+1.036
2.07%
jan 1, 1994
51.099
+0.13
0.26%
jan 1, 1995
50.745
-0.353
-0.69%
jan 1, 1996
50.446
-0.3
-0.59%
jan 1, 1997
51.877
+1.431
2.84%
jan 1, 1998
53.041
+1.164
2.24%
jan 1, 1999
53.345
+0.304
0.57%
jan 1, 2000
54.274
+0.929
1.74%
jan 1, 2001
53.671
-0.603
-1.11%
jan 1, 2002
49.127
-4.544
-8.47%
jan 1, 2003
51.115
+1.988
4.05%
jan 1, 2004
50.286
-0.829
-1.62%
jan 1, 2005
49.112
-1.173
-2.33%
jan 1, 2006
48.463
-0.649
-1.32%
jan 1, 2007
46.633
-1.831
-3.78%
jan 1, 2008
45.322
-1.31
-2.81%
jan 1, 2009
43.995
-1.327
-2.93%
jan 1, 2010
42.185
-1.81
-4.11%
jan 1, 2011
40.691
-1.494
-3.54%
jan 1, 2012
39.476
-1.214
-2.98%
jan 1, 2013
37.743
-1.734
-4.39%
jan 1, 2014
36.386
-1.356
-3.59%
jan 1, 2015
34.994
-1.392
-3.83%
jan 1, 2016
34.346
-0.648
-1.85%
Ranking of countries by current statistics by years


Comments: