29
/
en
AIzaSyAYiBZKx7MnpbEhh9jyipgxe19OcubqV5w
April 1, 2024
141340
Gibraltar
GIB
true
2
1
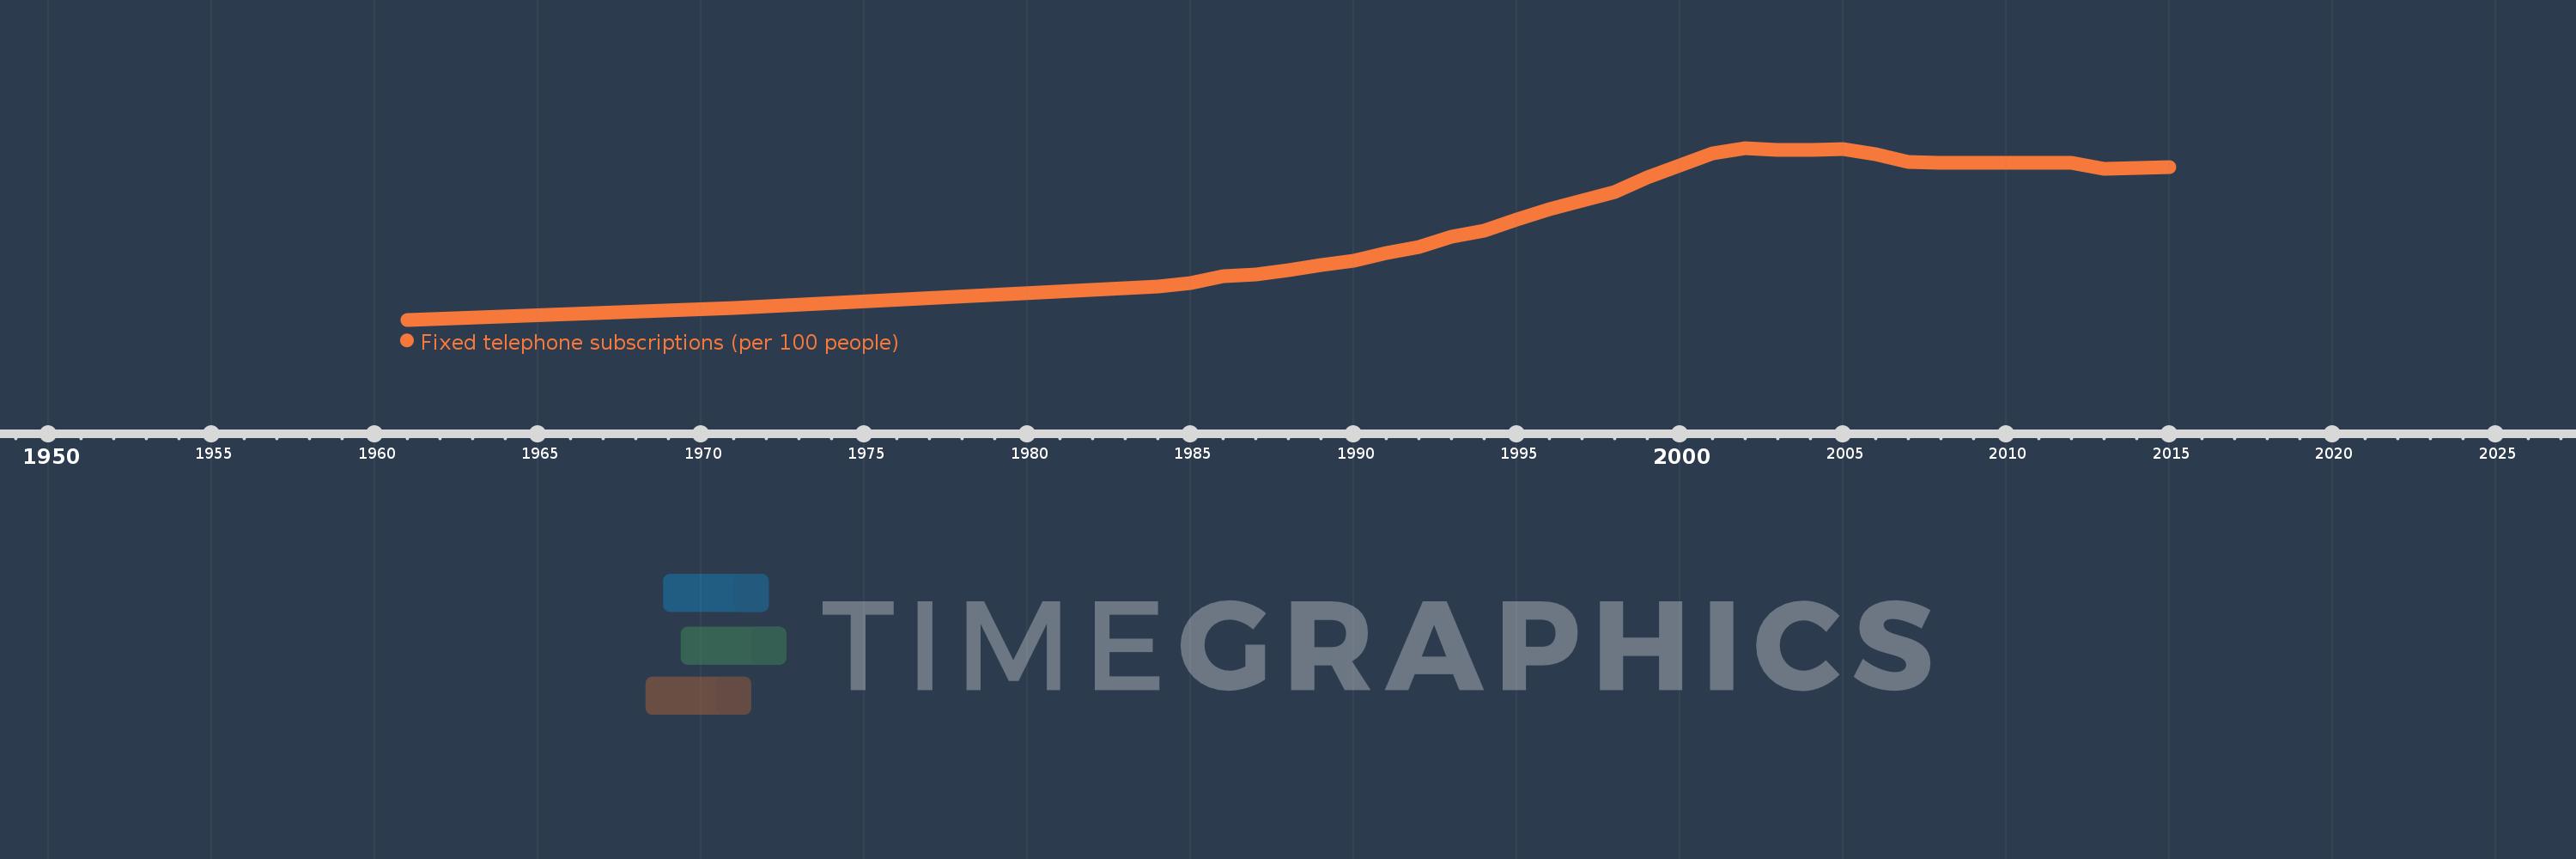
Fixed telephone subscriptions (per 100 people)
2015,2013,2012,2011,2010,2009,2008,2007,2006,2005,2004,2003,2002,2001,2000,1999,1998,1997,1996,1995,1994,1993,1992,1991,1990,1989,1988,1987,1986,1985,1984,1971,1961
This statistics in other country:
AfghanistanAlbaniaAlgeriaAmerican SamoaAndorraAngolaAntigua and BarbudaArab WorldArgentinaArmeniaArubaAustraliaAustriaAzerbaijanBahamas, TheBahrainBangladeshBarbadosBelarusBelgiumBelizeBeninBermudaBhutanBoliviaBosnia and HerzegovinaBotswanaBrazilBritish Virgin IslandsBrunei DarussalamBulgariaBurkina FasoBurundiCabo VerdeCambodiaCameroonCanadaCaribbean small statesCayman IslandsCentral African RepublicCentral Europe and the BalticsChadChileChinaColombiaComorosCongo, Dem. Rep.Congo, Rep.Costa RicaCote d'IvoireCroatiaCubaCuracaoCyprusCzech RepublicDenmarkDjiboutiDominicaDominican RepublicEarly-demographic dividendEast Asia & PacificEast Asia & Pacific (excluding high income)East Asia & Pacific (IDA & IBRD countries)EcuadorEgypt, Arab Rep.El SalvadorEquatorial GuineaEritreaEstoniaEthiopiaEuro areaEurope & Central AsiaEurope & Central Asia (excluding high income)Europe & Central Asia (IDA & IBRD countries)European UnionFaroe IslandsFijiFinlandFragile and conflict affected situationsFranceFrench PolynesiaGabonGambia, TheGeorgiaGermanyGhanaGibraltarGreeceGreenlandGrenadaGuamGuatemalaGuineaGuinea-BissauGuyanaHaitiHeavily indebted poor countries (HIPC)High incomeHondurasHong Kong SAR, ChinaHungaryIBRD onlyIcelandIDA & IBRD totalIDA blendIDA onlyIDA totalIndiaIndonesiaIran, Islamic Rep.IraqIrelandIsraelItalyJamaicaJapanJordanKazakhstanKenyaKiribatiKorea, Dem. People’s Rep.Korea, Rep.KosovoKuwaitKyrgyz RepublicLao PDRLate-demographic dividendLatin America & Caribbean Latin America & Caribbean (excluding high income)Latin America & the Caribbean (IDA & IBRD countries)LatviaLeast developed countries: UN classificationLebanonLesothoLiberiaLibyaLiechtensteinLithuaniaLow & middle incomeLow incomeLower middle incomeLuxembourgMacao SAR, ChinaMacedonia, FYRMadagascarMalawiMalaysiaMaldivesMaliMaltaMarshall IslandsMauritaniaMauritiusMexicoMicronesia, Fed. Sts.Middle East & North AfricaMiddle East & North Africa (excluding high income)Middle East & North Africa (IDA & IBRD countries)Middle incomeMoldovaMonacoMongoliaMontenegroMoroccoMozambiqueMyanmarNamibiaNauruNepalNetherlandsNew CaledoniaNew ZealandNicaraguaNigerNigeriaNorth AmericaNorthern Mariana IslandsNorwayOECD membersOmanOther small statesPacific island small statesPakistanPalauPanamaPapua New GuineaParaguayPeruPhilippinesPolandPortugalPost-demographic dividendPre-demographic dividendPuerto RicoQatarRomaniaRussian FederationRwandaSamoaSan MarinoSao Tome and PrincipeSaudi ArabiaSenegalSerbiaSeychellesSierra LeoneSingaporeSlovak RepublicSloveniaSmall statesSolomon IslandsSomaliaSouth AfricaSouth AsiaSouth Asia (IDA & IBRD)South SudanSpainSri LankaSt. Kitts and NevisSt. LuciaSt. Vincent and the GrenadinesSub-Saharan Africa Sub-Saharan Africa (excluding high income)Sub-Saharan Africa (IDA & IBRD countries)SudanSurinameSwazilandSwedenSwitzerlandSyrian Arab RepublicTajikistanTanzaniaThailandTimor-LesteTogoTongaTrinidad and TobagoTunisiaTurkeyTurkmenistanTurks and Caicos IslandsTuvaluUgandaUkraineUnited Arab EmiratesUnited KingdomUnited StatesUpper middle incomeUruguayUzbekistanVanuatuVenezuela, RBVietnamVirgin Islands (U.S.)West Bank and GazaWorldYemen, Rep.ZambiaZimbabwe Timeline:
This timeline shows a graph from 1961 to 2015 of Gibraltar. No data until 1960. Number of actual observations by date: 33.
Source name:
World Development Indicators
Source organization:
International Telecommunication Union, World Telecommunication/ICT Development Report and database.
Categories, topics:
Infrastructure
Last updated:
apr 23, 2017
Indicators value changes by year
Maximum:
88.754
jan 1, 2002
At the date of observation
Value
Absolute change
Change from previous value
jan 1, 1961
9.104
+9.104
0.0%
jan 1, 1971
14.598
+5.494
60.35%
jan 1, 1984
24.39
+9.792
67.08%
jan 1, 1985
26.295
+1.905
7.81%
jan 1, 1986
29.36
+3.065
11.66%
jan 1, 1987
30.049
+0.689
2.35%
jan 1, 1988
31.891
+1.842
6.13%
jan 1, 1989
34.386
+2.494
7.82%
jan 1, 1990
36.297
+1.911
5.56%
jan 1, 1991
40.063
+3.766
10.38%
jan 1, 1992
42.865
+2.802
7.0%
jan 1, 1993
47.461
+4.596
10.72%
jan 1, 1994
50.313
+2.852
6.01%
jan 1, 1995
55.638
+5.325
10.58%
jan 1, 1996
60.535
+4.897
8.8%
jan 1, 1997
64.15
+3.614
5.97%
jan 1, 1998
68.414
+4.265
6.65%
jan 1, 1999
74.951
+6.537
9.55%
jan 1, 2000
80.529
+5.578
7.44%
jan 1, 2001
86.07
+5.541
6.88%
jan 1, 2002
88.754
+2.684
3.12%
jan 1, 2003
87.711
-1.043
-1.18%
jan 1, 2004
87.988
+0.277
0.32%
jan 1, 2005
88.047
+0.059
0.07%
jan 1, 2006
85.97
-2.077
-2.36%
jan 1, 2007
82.074
-3.896
-4.53%
jan 1, 2008
81.9
-0.174
-0.21%
jan 1, 2009
81.922
+0.022
0.03%
jan 1, 2010
82.004
+0.081
0.1%
jan 1, 2011
82.043
+0.039
0.05%
jan 1, 2012
82.018
-0.025
-0.03%
jan 1, 2013
78.915
-3.102
-3.78%
jan 1, 2015
79.768
+0.853
1.08%
Ranking of countries by current statistics by years


Comments: