29
/
en
AIzaSyAYiBZKx7MnpbEhh9jyipgxe19OcubqV5w
April 1, 2024
69787
Argentina
ARG
true
2
1
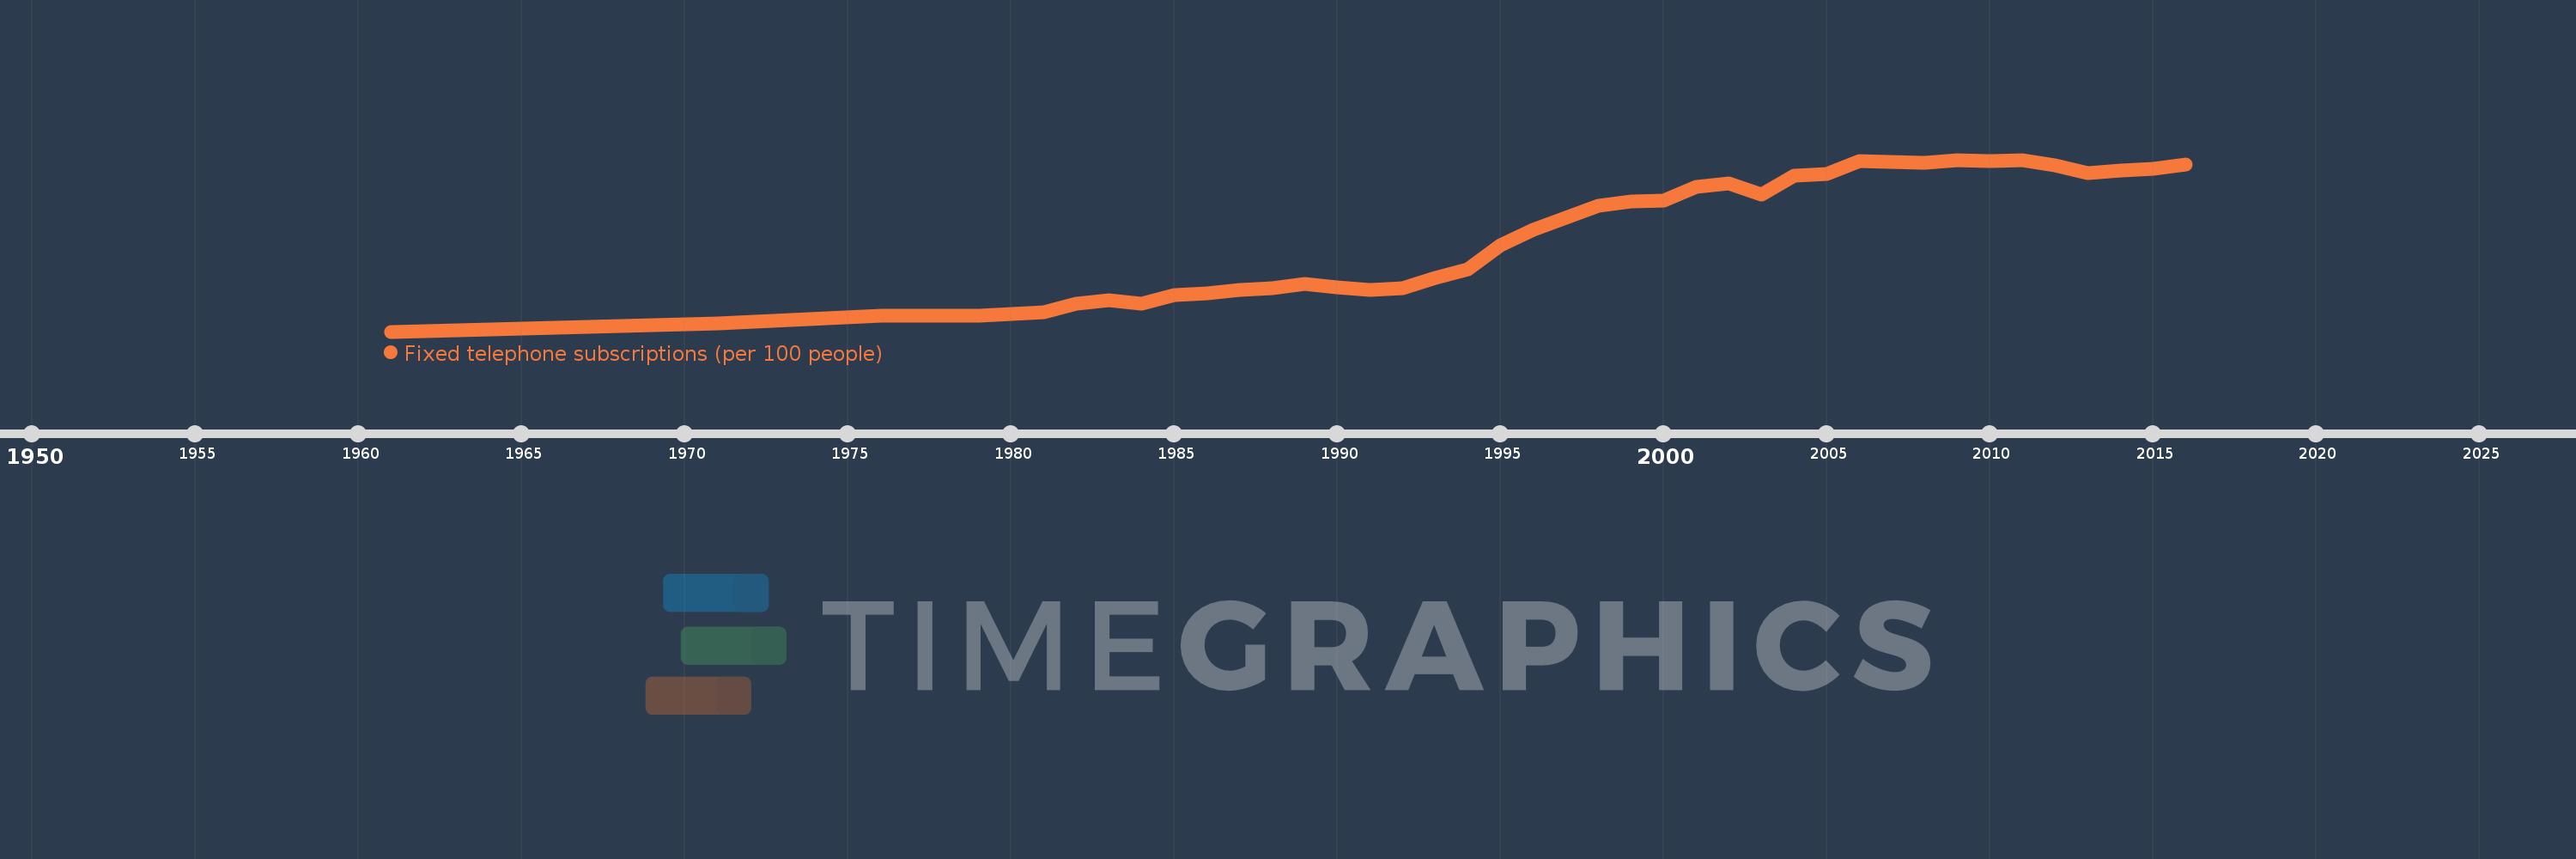
Fixed telephone subscriptions (per 100 people)
2016,2015,2014,2013,2012,2011,2010,2009,2008,2007,2006,2005,2004,2003,2002,2001,2000,1999,1998,1997,1996,1995,1994,1993,1992,1991,1990,1989,1988,1987,1986,1985,1984,1983,1982,1981,1980,1979,1978,1977,1976,1971,1966,1961
This statistics in other country:
AfghanistanAlbaniaAlgeriaAmerican SamoaAndorraAngolaAntigua and BarbudaArab WorldArgentinaArmeniaArubaAustraliaAustriaAzerbaijanBahamas, TheBahrainBangladeshBarbadosBelarusBelgiumBelizeBeninBermudaBhutanBoliviaBosnia and HerzegovinaBotswanaBrazilBritish Virgin IslandsBrunei DarussalamBulgariaBurkina FasoBurundiCabo VerdeCambodiaCameroonCanadaCaribbean small statesCayman IslandsCentral African RepublicCentral Europe and the BalticsChadChileChinaColombiaComorosCongo, Dem. Rep.Congo, Rep.Costa RicaCote d'IvoireCroatiaCubaCuracaoCyprusCzech RepublicDenmarkDjiboutiDominicaDominican RepublicEarly-demographic dividendEast Asia & PacificEast Asia & Pacific (excluding high income)East Asia & Pacific (IDA & IBRD countries)EcuadorEgypt, Arab Rep.El SalvadorEquatorial GuineaEritreaEstoniaEthiopiaEuro areaEurope & Central AsiaEurope & Central Asia (excluding high income)Europe & Central Asia (IDA & IBRD countries)European UnionFaroe IslandsFijiFinlandFragile and conflict affected situationsFranceFrench PolynesiaGabonGambia, TheGeorgiaGermanyGhanaGibraltarGreeceGreenlandGrenadaGuamGuatemalaGuineaGuinea-BissauGuyanaHaitiHeavily indebted poor countries (HIPC)High incomeHondurasHong Kong SAR, ChinaHungaryIBRD onlyIcelandIDA & IBRD totalIDA blendIDA onlyIDA totalIndiaIndonesiaIran, Islamic Rep.IraqIrelandIsraelItalyJamaicaJapanJordanKazakhstanKenyaKiribatiKorea, Dem. People’s Rep.Korea, Rep.KosovoKuwaitKyrgyz RepublicLao PDRLate-demographic dividendLatin America & Caribbean Latin America & Caribbean (excluding high income)Latin America & the Caribbean (IDA & IBRD countries)LatviaLeast developed countries: UN classificationLebanonLesothoLiberiaLibyaLiechtensteinLithuaniaLow & middle incomeLow incomeLower middle incomeLuxembourgMacao SAR, ChinaMacedonia, FYRMadagascarMalawiMalaysiaMaldivesMaliMaltaMarshall IslandsMauritaniaMauritiusMexicoMicronesia, Fed. Sts.Middle East & North AfricaMiddle East & North Africa (excluding high income)Middle East & North Africa (IDA & IBRD countries)Middle incomeMoldovaMonacoMongoliaMontenegroMoroccoMozambiqueMyanmarNamibiaNauruNepalNetherlandsNew CaledoniaNew ZealandNicaraguaNigerNigeriaNorth AmericaNorthern Mariana IslandsNorwayOECD membersOmanOther small statesPacific island small statesPakistanPalauPanamaPapua New GuineaParaguayPeruPhilippinesPolandPortugalPost-demographic dividendPre-demographic dividendPuerto RicoQatarRomaniaRussian FederationRwandaSamoaSan MarinoSao Tome and PrincipeSaudi ArabiaSenegalSerbiaSeychellesSierra LeoneSingaporeSlovak RepublicSloveniaSmall statesSolomon IslandsSomaliaSouth AfricaSouth AsiaSouth Asia (IDA & IBRD)South SudanSpainSri LankaSt. Kitts and NevisSt. LuciaSt. Vincent and the GrenadinesSub-Saharan Africa Sub-Saharan Africa (excluding high income)Sub-Saharan Africa (IDA & IBRD countries)SudanSurinameSwazilandSwedenSwitzerlandSyrian Arab RepublicTajikistanTanzaniaThailandTimor-LesteTogoTongaTrinidad and TobagoTunisiaTurkeyTurkmenistanTurks and Caicos IslandsTuvaluUgandaUkraineUnited Arab EmiratesUnited KingdomUnited StatesUpper middle incomeUruguayUzbekistanVanuatuVenezuela, RBVietnamVirgin Islands (U.S.)West Bank and GazaWorldYemen, Rep.ZambiaZimbabwe Timeline:
This timeline shows a graph from 1961 to 2016 of Argentina. No data until 1960. Number of actual observations by date: 44.
Source name:
World Development Indicators
Source organization:
International Telecommunication Union, World Telecommunication/ICT Development Report and database.
Categories, topics:
Infrastructure
Last updated:
apr 23, 2017
Indicators value changes by year
Maximum:
24.556
jan 1, 2009
At the date of observation
Value
Absolute change
Change from previous value
jan 1, 1961
4.435
+4.435
0.0%
jan 1, 1966
4.934
+0.499
11.26%
jan 1, 1971
5.367
+0.433
8.78%
jan 1, 1976
6.333
+0.966
17.99%
jan 1, 1977
6.336
+0.003
0.05%
jan 1, 1978
6.292
-0.044
-0.69%
jan 1, 1979
6.331
+0.039
0.62%
jan 1, 1980
6.487
+0.156
2.46%
jan 1, 1981
6.682
+0.195
3.01%
jan 1, 1982
7.702
+1.02
15.27%
jan 1, 1983
8.146
+0.443
5.76%
jan 1, 1984
7.717
-0.429
-5.26%
jan 1, 1985
8.698
+0.981
12.72%
jan 1, 1986
8.935
+0.237
2.72%
jan 1, 1987
9.284
+0.349
3.91%
jan 1, 1988
9.49
+0.206
2.21%
jan 1, 1989
10.014
+0.524
5.52%
jan 1, 1990
9.586
-0.428
-4.27%
jan 1, 1991
9.277
-0.309
-3.22%
jan 1, 1992
9.467
+0.19
2.04%
jan 1, 1993
10.723
+1.256
13.27%
jan 1, 1994
11.726
+1.003
9.35%
jan 1, 1995
14.497
+2.771
23.63%
jan 1, 1996
16.404
+1.907
13.16%
jan 1, 1997
17.759
+1.355
8.26%
jan 1, 1998
19.128
+1.368
7.71%
jan 1, 1999
19.65
+0.522
2.73%
jan 1, 2000
19.782
+0.132
0.67%
jan 1, 2001
21.392
+1.61
8.14%
jan 1, 2002
21.816
+0.424
1.98%
jan 1, 2003
20.487
-1.329
-6.09%
jan 1, 2004
22.659
+2.173
10.61%
jan 1, 2005
22.868
+0.209
0.92%
jan 1, 2006
24.43
+1.562
6.83%
jan 1, 2007
24.263
-0.167
-0.68%
jan 1, 2008
24.154
-0.109
-0.45%
jan 1, 2009
24.556
+0.402
1.67%
jan 1, 2010
24.406
-0.15
-0.61%
jan 1, 2011
24.556
+0.15
0.61%
jan 1, 2012
23.871
-0.684
-2.79%
jan 1, 2013
23.014
-0.858
-3.59%
jan 1, 2014
23.312
+0.299
1.3%
jan 1, 2015
23.497
+0.185
0.79%
jan 1, 2016
24.007
+0.51
2.17%
Ranking of countries by current statistics by years


Comments: