29
/
en
AIzaSyAYiBZKx7MnpbEhh9jyipgxe19OcubqV5w
April 1, 2024
94842
Burkina Faso
BFA
true
2
1
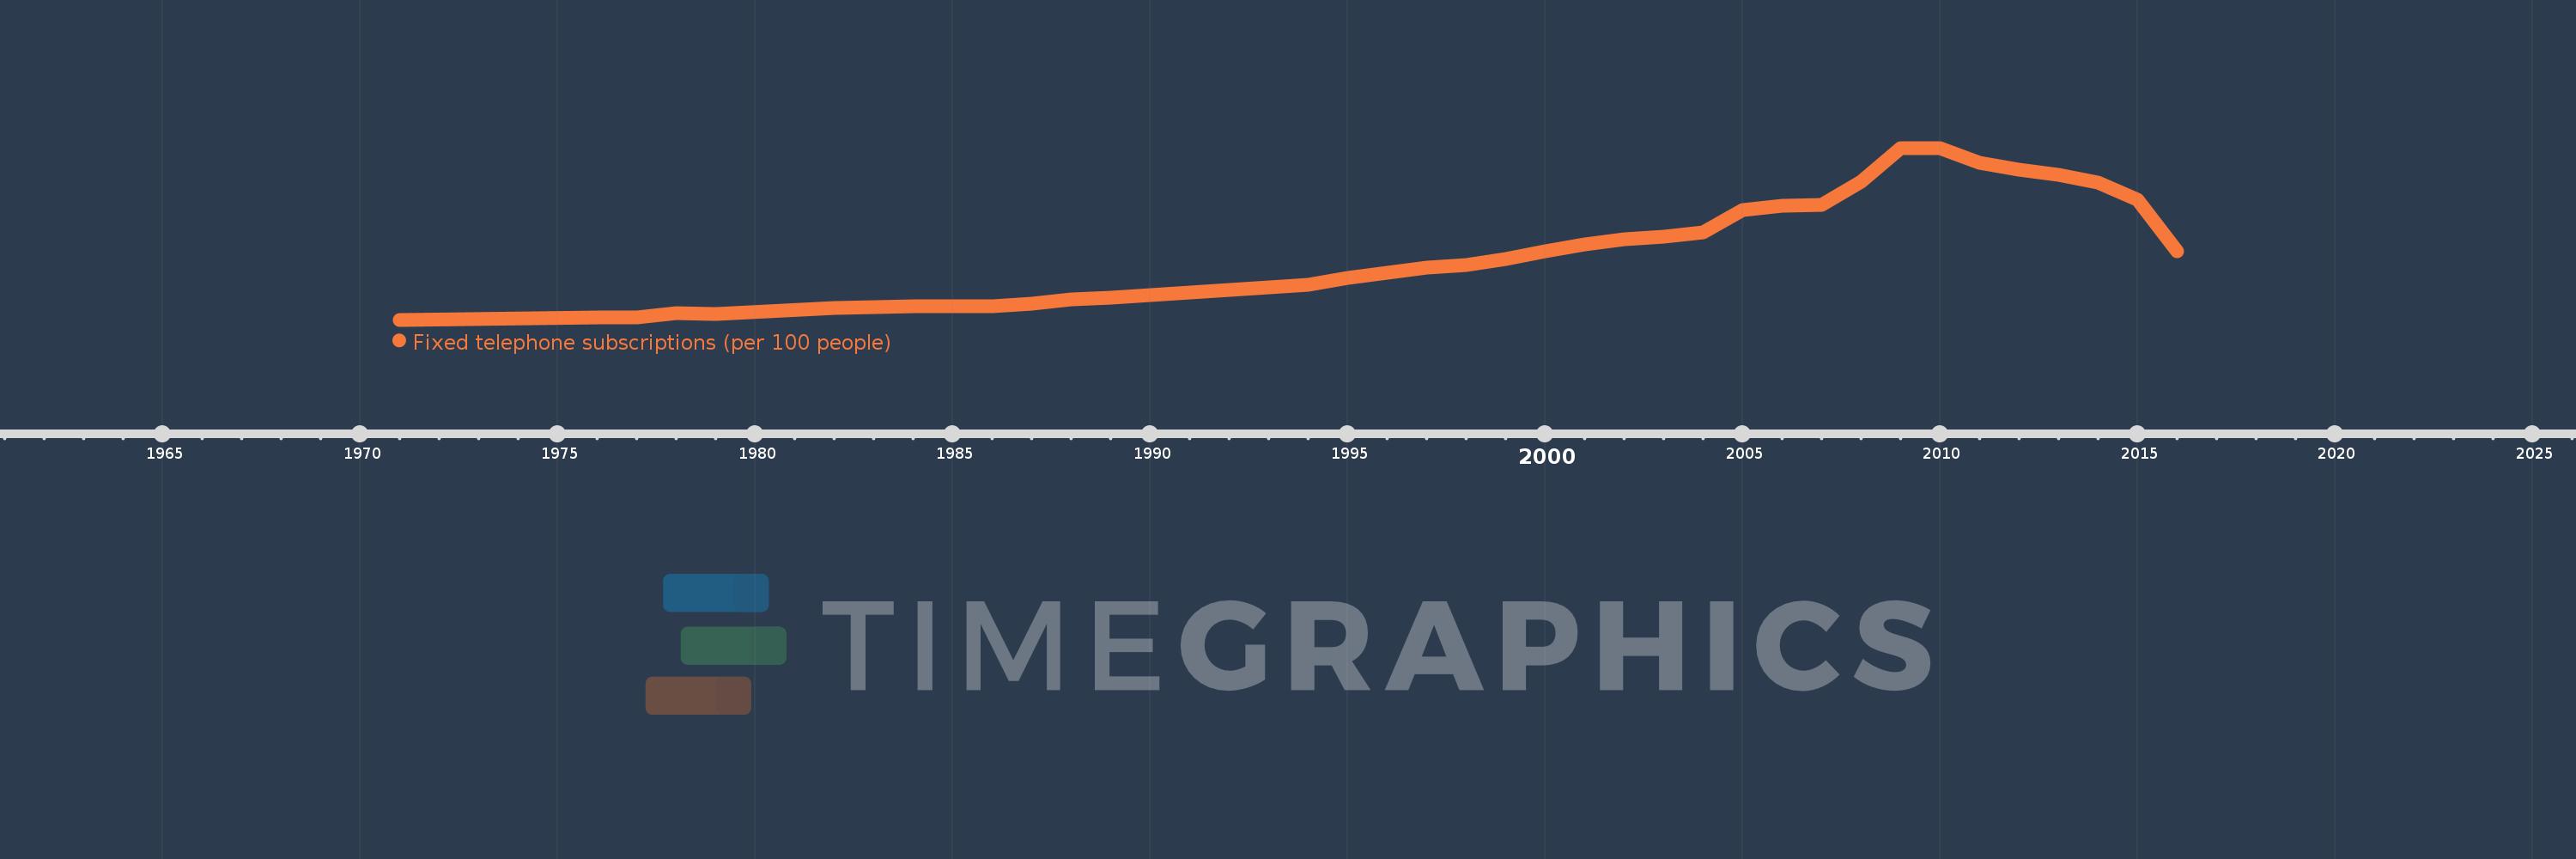
Fixed telephone subscriptions (per 100 people)
2016,2015,2014,2013,2012,2011,2010,2009,2008,2007,2006,2005,2004,2003,2002,2001,2000,1999,1998,1997,1996,1995,1994,1993,1992,1991,1990,1989,1988,1987,1986,1985,1984,1983,1982,1979,1978,1977,1976,1971
This statistics in other country:
AfghanistanAlbaniaAlgeriaAmerican SamoaAndorraAngolaAntigua and BarbudaArab WorldArgentinaArmeniaArubaAustraliaAustriaAzerbaijanBahamas, TheBahrainBangladeshBarbadosBelarusBelgiumBelizeBeninBermudaBhutanBoliviaBosnia and HerzegovinaBotswanaBrazilBritish Virgin IslandsBrunei DarussalamBulgariaBurkina FasoBurundiCabo VerdeCambodiaCameroonCanadaCaribbean small statesCayman IslandsCentral African RepublicCentral Europe and the BalticsChadChileChinaColombiaComorosCongo, Dem. Rep.Congo, Rep.Costa RicaCote d'IvoireCroatiaCubaCuracaoCyprusCzech RepublicDenmarkDjiboutiDominicaDominican RepublicEarly-demographic dividendEast Asia & PacificEast Asia & Pacific (excluding high income)East Asia & Pacific (IDA & IBRD countries)EcuadorEgypt, Arab Rep.El SalvadorEquatorial GuineaEritreaEstoniaEthiopiaEuro areaEurope & Central AsiaEurope & Central Asia (excluding high income)Europe & Central Asia (IDA & IBRD countries)European UnionFaroe IslandsFijiFinlandFragile and conflict affected situationsFranceFrench PolynesiaGabonGambia, TheGeorgiaGermanyGhanaGibraltarGreeceGreenlandGrenadaGuamGuatemalaGuineaGuinea-BissauGuyanaHaitiHeavily indebted poor countries (HIPC)High incomeHondurasHong Kong SAR, ChinaHungaryIBRD onlyIcelandIDA & IBRD totalIDA blendIDA onlyIDA totalIndiaIndonesiaIran, Islamic Rep.IraqIrelandIsraelItalyJamaicaJapanJordanKazakhstanKenyaKiribatiKorea, Dem. People’s Rep.Korea, Rep.KosovoKuwaitKyrgyz RepublicLao PDRLate-demographic dividendLatin America & Caribbean Latin America & Caribbean (excluding high income)Latin America & the Caribbean (IDA & IBRD countries)LatviaLeast developed countries: UN classificationLebanonLesothoLiberiaLibyaLiechtensteinLithuaniaLow & middle incomeLow incomeLower middle incomeLuxembourgMacao SAR, ChinaMacedonia, FYRMadagascarMalawiMalaysiaMaldivesMaliMaltaMarshall IslandsMauritaniaMauritiusMexicoMicronesia, Fed. Sts.Middle East & North AfricaMiddle East & North Africa (excluding high income)Middle East & North Africa (IDA & IBRD countries)Middle incomeMoldovaMonacoMongoliaMontenegroMoroccoMozambiqueMyanmarNamibiaNauruNepalNetherlandsNew CaledoniaNew ZealandNicaraguaNigerNigeriaNorth AmericaNorthern Mariana IslandsNorwayOECD membersOmanOther small statesPacific island small statesPakistanPalauPanamaPapua New GuineaParaguayPeruPhilippinesPolandPortugalPost-demographic dividendPre-demographic dividendPuerto RicoQatarRomaniaRussian FederationRwandaSamoaSan MarinoSao Tome and PrincipeSaudi ArabiaSenegalSerbiaSeychellesSierra LeoneSingaporeSlovak RepublicSloveniaSmall statesSolomon IslandsSomaliaSouth AfricaSouth AsiaSouth Asia (IDA & IBRD)South SudanSpainSri LankaSt. Kitts and NevisSt. LuciaSt. Vincent and the GrenadinesSub-Saharan Africa Sub-Saharan Africa (excluding high income)Sub-Saharan Africa (IDA & IBRD countries)SudanSurinameSwazilandSwedenSwitzerlandSyrian Arab RepublicTajikistanTanzaniaThailandTimor-LesteTogoTongaTrinidad and TobagoTunisiaTurkeyTurkmenistanTurks and Caicos IslandsTuvaluUgandaUkraineUnited Arab EmiratesUnited KingdomUnited StatesUpper middle incomeUruguayUzbekistanVanuatuVenezuela, RBVietnamVirgin Islands (U.S.)West Bank and GazaWorldYemen, Rep.ZambiaZimbabwe Timeline:
This timeline shows a graph from 1971 to 2016 of Burkina Faso. No data until 1970. Number of actual observations by date: 40.
Source name:
World Development Indicators
Source organization:
International Telecommunication Union, World Telecommunication/ICT Development Report and database.
Categories, topics:
Infrastructure
Last updated:
apr 23, 2017
Indicators value changes by year
At the date of observation
Value
Absolute change
Change from previous value
jan 1, 1971
0.027
+0.027
0.0%
jan 1, 1976
0.039
+0.012
46.22%
jan 1, 1977
0.041
+0.002
6.27%
jan 1, 1978
0.063
+0.021
50.84%
jan 1, 1979
0.061
-0.001
-2.02%
jan 1, 1982
0.095
+0.034
55.9%
jan 1, 1983
0.1
+0.005
5.04%
jan 1, 1984
0.102
+0.002
1.69%
jan 1, 1985
0.104
+0.002
1.5%
jan 1, 1986
0.103
-0.001
-0.63%
jan 1, 1987
0.121
+0.018
17.45%
jan 1, 1988
0.142
+0.021
17.5%
jan 1, 1989
0.153
+0.011
7.93%
jan 1, 1990
0.169
+0.016
10.25%
jan 1, 1991
0.184
+0.015
8.73%
jan 1, 1992
0.197
+0.014
7.35%
jan 1, 1993
0.213
+0.016
7.93%
jan 1, 1994
0.229
+0.016
7.6%
jan 1, 1995
0.268
+0.039
17.13%
jan 1, 1996
0.298
+0.03
11.02%
jan 1, 1997
0.328
+0.031
10.26%
jan 1, 1998
0.34
+0.012
3.55%
jan 1, 1999
0.376
+0.036
10.54%
jan 1, 2000
0.42
+0.044
11.65%
jan 1, 2001
0.458
+0.039
9.26%
jan 1, 2002
0.486
+0.027
5.97%
jan 1, 2003
0.503
+0.018
3.63%
jan 1, 2004
0.526
+0.023
4.56%
jan 1, 2005
0.654
+0.127
24.21%
jan 1, 2006
0.679
+0.026
3.91%
jan 1, 2007
0.686
+0.006
0.9%
jan 1, 2008
0.82
+0.135
19.63%
jan 1, 2009
1.011
+0.191
23.23%
jan 1, 2010
1.01
-0.001
-0.06%
jan 1, 2011
0.926
-0.084
-8.28%
jan 1, 2012
0.885
-0.042
-4.49%
jan 1, 2013
0.859
-0.026
-2.94%
jan 1, 2014
0.811
-0.047
-5.51%
jan 1, 2015
0.715
-0.096
-11.86%
jan 1, 2016
0.419
-0.296
-41.41%
Ranking of countries by current statistics by years


Comments: