29
/
en
AIzaSyAYiBZKx7MnpbEhh9jyipgxe19OcubqV5w
April 1, 2024
276619
United States
USA
true
2
1
Fixed telephone subscriptions (per 100 people)
2016,2015,2014,2013,2012,2011,2010,2009,2008,2007,2006,2005,2004,2003,2002,2001,2000,1999,1998,1997,1996,1995,1994,1993,1992,1991,1990,1989,1988,1987,1986,1985,1984,1983,1982,1981,1980,1979,1978,1977,1976,1971,1966,1961
This statistics in other country:
AfghanistanAlbaniaAlgeriaAmerican SamoaAndorraAngolaAntigua and BarbudaArab WorldArgentinaArmeniaArubaAustraliaAustriaAzerbaijanBahamas, TheBahrainBangladeshBarbadosBelarusBelgiumBelizeBeninBermudaBhutanBoliviaBosnia and HerzegovinaBotswanaBrazilBritish Virgin IslandsBrunei DarussalamBulgariaBurkina FasoBurundiCabo VerdeCambodiaCameroonCanadaCaribbean small statesCayman IslandsCentral African RepublicCentral Europe and the BalticsChadChileChinaColombiaComorosCongo, Dem. Rep.Congo, Rep.Costa RicaCote d'IvoireCroatiaCubaCuracaoCyprusCzech RepublicDenmarkDjiboutiDominicaDominican RepublicEarly-demographic dividendEast Asia & PacificEast Asia & Pacific (excluding high income)East Asia & Pacific (IDA & IBRD countries)EcuadorEgypt, Arab Rep.El SalvadorEquatorial GuineaEritreaEstoniaEthiopiaEuro areaEurope & Central AsiaEurope & Central Asia (excluding high income)Europe & Central Asia (IDA & IBRD countries)European UnionFaroe IslandsFijiFinlandFragile and conflict affected situationsFranceFrench PolynesiaGabonGambia, TheGeorgiaGermanyGhanaGibraltarGreeceGreenlandGrenadaGuamGuatemalaGuineaGuinea-BissauGuyanaHaitiHeavily indebted poor countries (HIPC)High incomeHondurasHong Kong SAR, ChinaHungaryIBRD onlyIcelandIDA & IBRD totalIDA blendIDA onlyIDA totalIndiaIndonesiaIran, Islamic Rep.IraqIrelandIsraelItalyJamaicaJapanJordanKazakhstanKenyaKiribatiKorea, Dem. People’s Rep.Korea, Rep.KosovoKuwaitKyrgyz RepublicLao PDRLate-demographic dividendLatin America & Caribbean Latin America & Caribbean (excluding high income)Latin America & the Caribbean (IDA & IBRD countries)LatviaLeast developed countries: UN classificationLebanonLesothoLiberiaLibyaLiechtensteinLithuaniaLow & middle incomeLow incomeLower middle incomeLuxembourgMacao SAR, ChinaMacedonia, FYRMadagascarMalawiMalaysiaMaldivesMaliMaltaMarshall IslandsMauritaniaMauritiusMexicoMicronesia, Fed. Sts.Middle East & North AfricaMiddle East & North Africa (excluding high income)Middle East & North Africa (IDA & IBRD countries)Middle incomeMoldovaMonacoMongoliaMontenegroMoroccoMozambiqueMyanmarNamibiaNauruNepalNetherlandsNew CaledoniaNew ZealandNicaraguaNigerNigeriaNorth AmericaNorthern Mariana IslandsNorwayOECD membersOmanOther small statesPacific island small statesPakistanPalauPanamaPapua New GuineaParaguayPeruPhilippinesPolandPortugalPost-demographic dividendPre-demographic dividendPuerto RicoQatarRomaniaRussian FederationRwandaSamoaSan MarinoSao Tome and PrincipeSaudi ArabiaSenegalSerbiaSeychellesSierra LeoneSingaporeSlovak RepublicSloveniaSmall statesSolomon IslandsSomaliaSouth AfricaSouth AsiaSouth Asia (IDA & IBRD)South SudanSpainSri LankaSt. Kitts and NevisSt. LuciaSt. Vincent and the GrenadinesSub-Saharan Africa Sub-Saharan Africa (excluding high income)Sub-Saharan Africa (IDA & IBRD countries)SudanSurinameSwazilandSwedenSwitzerlandSyrian Arab RepublicTajikistanTanzaniaThailandTimor-LesteTogoTongaTrinidad and TobagoTunisiaTurkeyTurkmenistanTurks and Caicos IslandsTuvaluUgandaUkraineUnited Arab EmiratesUnited KingdomUnited StatesUpper middle incomeUruguayUzbekistanVanuatuVenezuela, RBVietnamVirgin Islands (U.S.)West Bank and GazaWorldYemen, Rep.ZambiaZimbabwe Timeline:
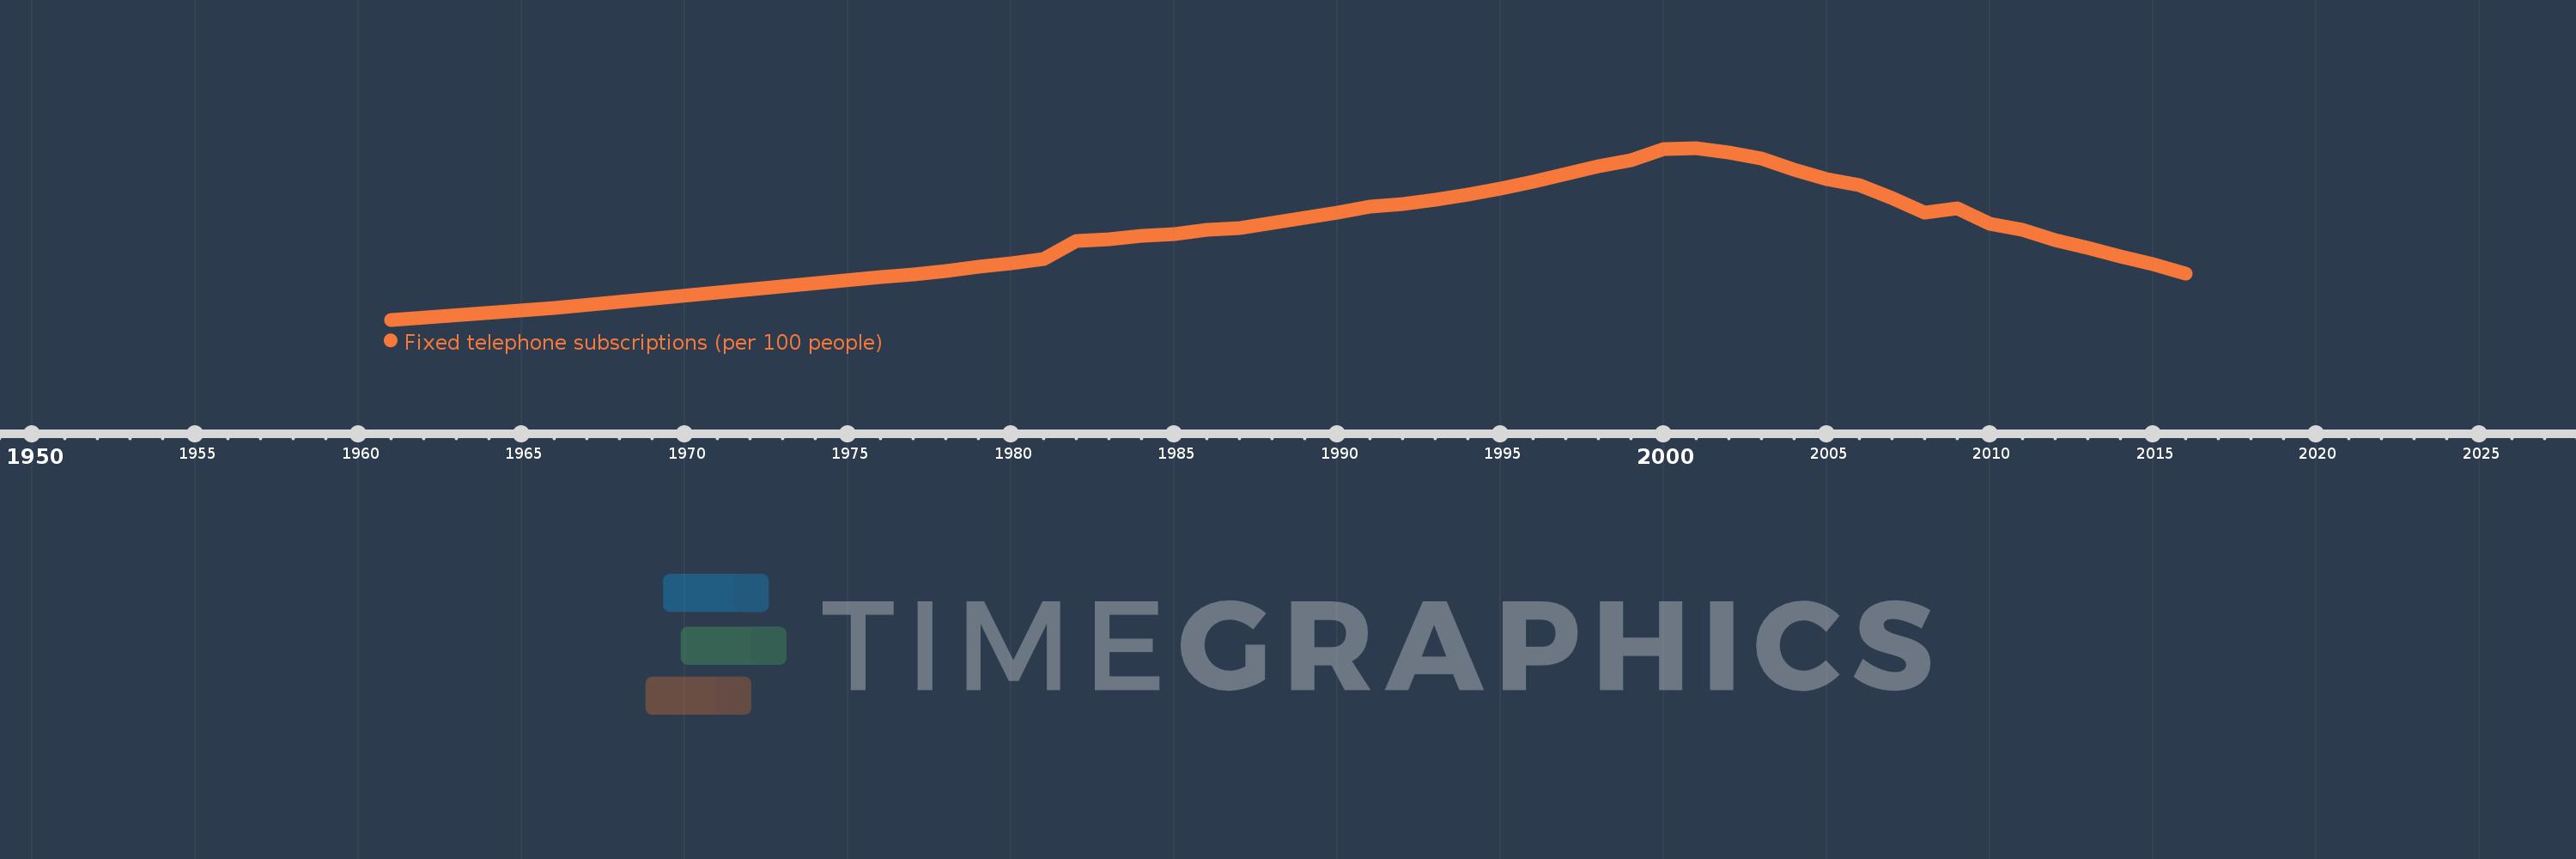
This timeline shows a graph from 1961 to 2016 of United States. No data until 1960. Number of actual observations by date: 44.
Source name:
World Development Indicators
Source organization:
International Telecommunication Union, World Telecommunication/ICT Development Report and database.
Categories, topics:
Infrastructure
Last updated:
apr 23, 2017
Indicators value changes by year
Minimum:
26.437
jan 1, 1961
Maximum:
67.645
jan 1, 2001
At the date of observation
Value
Absolute change
Change from previous value
jan 1, 1961
26.437
+26.437
0.0%
jan 1, 1966
29.19
+2.753
10.41%
jan 1, 1971
32.893
+3.702
12.68%
jan 1, 1976
36.691
+3.799
11.55%
jan 1, 1977
37.387
+0.695
1.9%
jan 1, 1978
38.209
+0.822
2.2%
jan 1, 1979
39.174
+0.965
2.53%
jan 1, 1980
40.039
+0.865
2.21%
jan 1, 1981
40.961
+0.922
2.3%
jan 1, 1982
45.413
+4.452
10.87%
jan 1, 1983
45.803
+0.39
0.86%
jan 1, 1984
46.656
+0.853
1.86%
jan 1, 1985
47.003
+0.347
0.74%
jan 1, 1986
47.954
+0.951
2.02%
jan 1, 1987
48.414
+0.46
0.96%
jan 1, 1988
49.746
+1.332
2.75%
jan 1, 1989
50.963
+1.217
2.45%
jan 1, 1990
52.199
+1.236
2.42%
jan 1, 1991
53.482
+1.283
2.46%
jan 1, 1992
54.23
+0.748
1.4%
jan 1, 1993
55.205
+0.975
1.8%
jan 1, 1994
56.466
+1.261
2.28%
jan 1, 1995
57.89
+1.423
2.52%
jan 1, 1996
59.565
+1.676
2.89%
jan 1, 1997
61.367
+1.801
3.02%
jan 1, 1998
63.315
+1.948
3.17%
jan 1, 1999
64.682
+1.367
2.16%
jan 1, 2000
67.338
+2.656
4.11%
jan 1, 2001
67.645
+0.307
0.46%
jan 1, 2002
66.626
-1.019
-1.51%
jan 1, 2003
65.198
-1.428
-2.14%
jan 1, 2004
62.46
-2.738
-4.2%
jan 1, 2005
60.135
-2.325
-3.72%
jan 1, 2006
58.746
-1.389
-2.31%
jan 1, 2007
55.645
-3.101
-5.28%
jan 1, 2008
52.148
-3.497
-6.28%
jan 1, 2009
53.077
+0.929
1.78%
jan 1, 2010
49.395
-3.682
-6.94%
jan 1, 2011
47.927
-1.467
-2.97%
jan 1, 2012
45.511
-2.417
-5.04%
jan 1, 2013
43.651
-1.86
-4.09%
jan 1, 2014
41.629
-2.023
-4.63%
jan 1, 2015
39.833
-1.796
-4.31%
jan 1, 2016
37.521
-2.312
-5.8%
Ranking of countries by current statistics by years


Comments: