29
/
en
AIzaSyAYiBZKx7MnpbEhh9jyipgxe19OcubqV5w
April 1, 2024
197525
Moldova
MDA
true
2
1
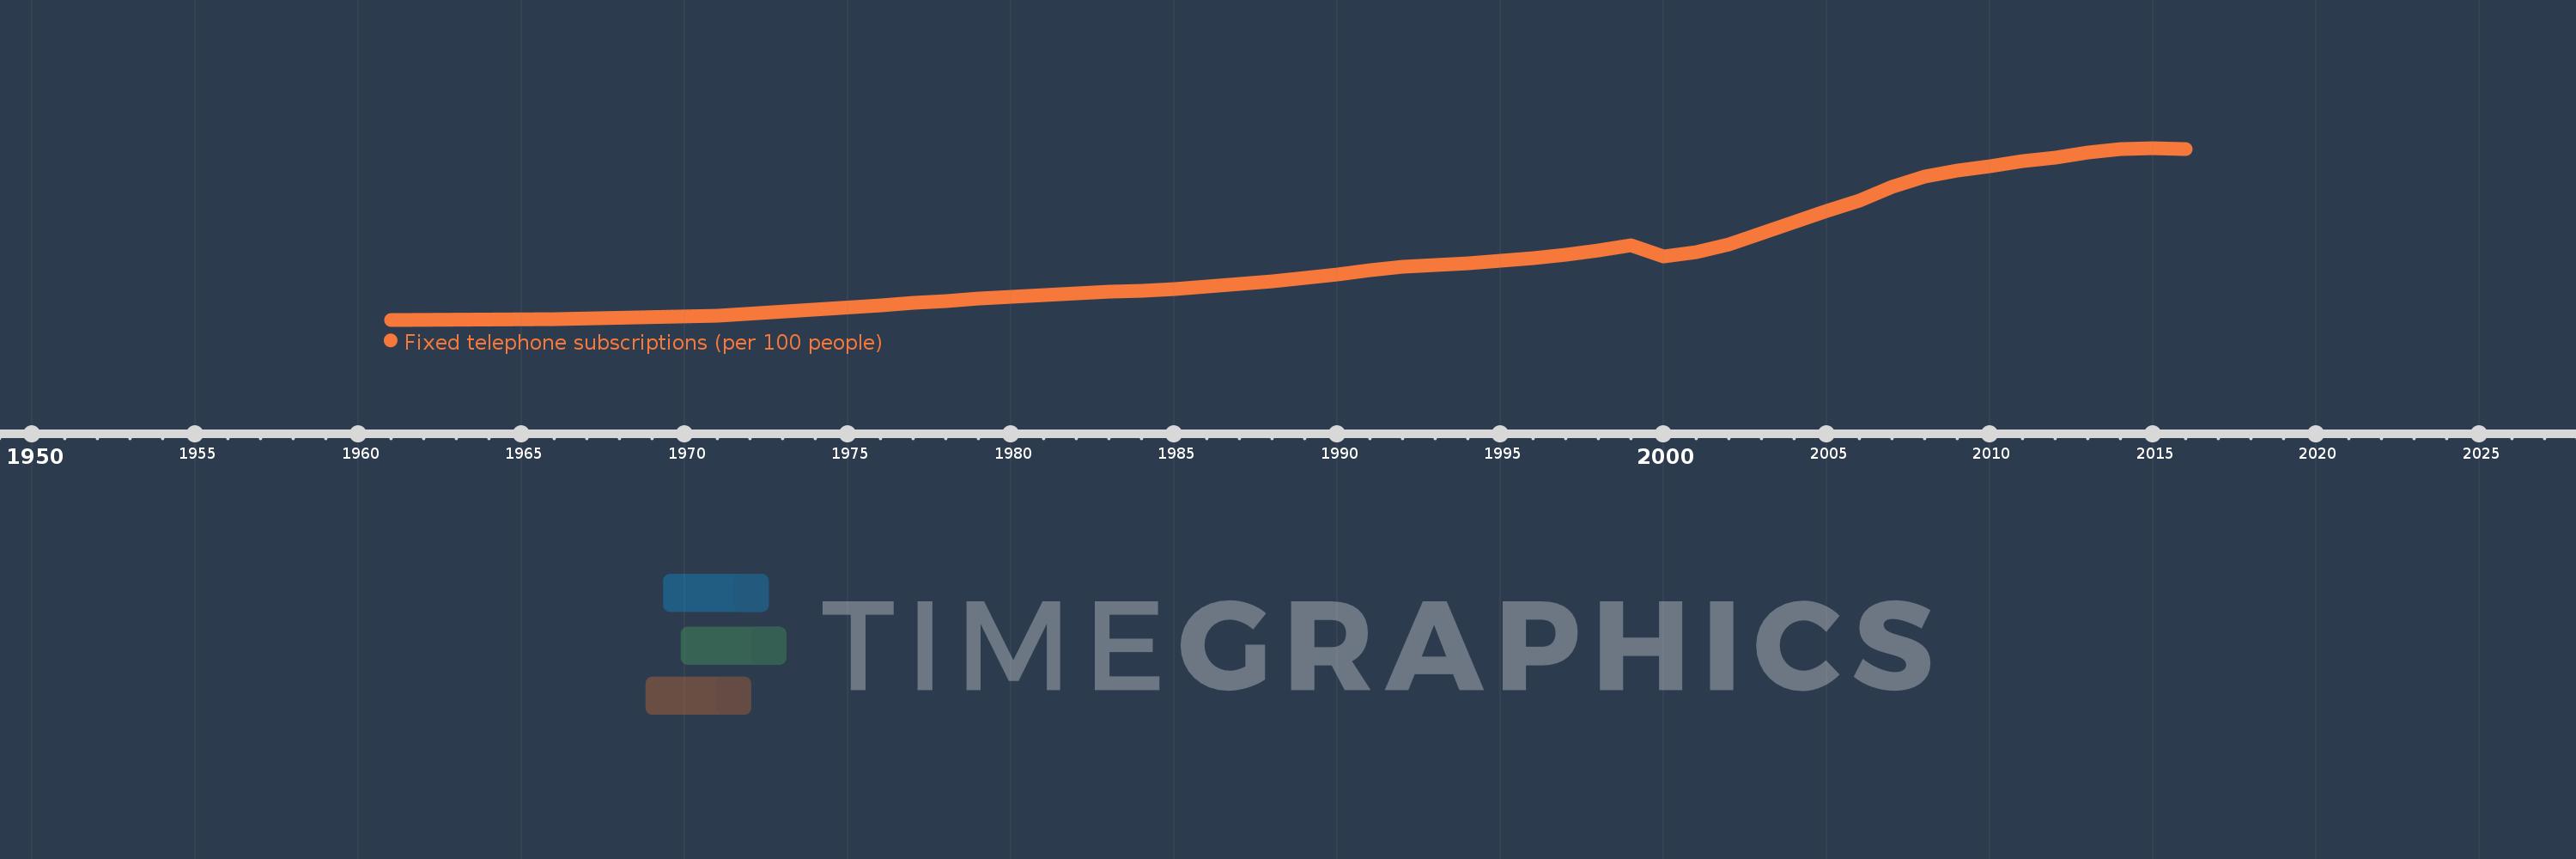
Fixed telephone subscriptions (per 100 people)
2016,2015,2014,2013,2012,2011,2010,2009,2008,2007,2006,2005,2004,2003,2002,2001,2000,1999,1998,1997,1996,1995,1994,1993,1992,1991,1990,1989,1988,1987,1986,1985,1984,1983,1982,1981,1980,1979,1978,1977,1976,1971,1966,1961
This statistics in other country:
AfghanistanAlbaniaAlgeriaAmerican SamoaAndorraAngolaAntigua and BarbudaArab WorldArgentinaArmeniaArubaAustraliaAustriaAzerbaijanBahamas, TheBahrainBangladeshBarbadosBelarusBelgiumBelizeBeninBermudaBhutanBoliviaBosnia and HerzegovinaBotswanaBrazilBritish Virgin IslandsBrunei DarussalamBulgariaBurkina FasoBurundiCabo VerdeCambodiaCameroonCanadaCaribbean small statesCayman IslandsCentral African RepublicCentral Europe and the BalticsChadChileChinaColombiaComorosCongo, Dem. Rep.Congo, Rep.Costa RicaCote d'IvoireCroatiaCubaCuracaoCyprusCzech RepublicDenmarkDjiboutiDominicaDominican RepublicEarly-demographic dividendEast Asia & PacificEast Asia & Pacific (excluding high income)East Asia & Pacific (IDA & IBRD countries)EcuadorEgypt, Arab Rep.El SalvadorEquatorial GuineaEritreaEstoniaEthiopiaEuro areaEurope & Central AsiaEurope & Central Asia (excluding high income)Europe & Central Asia (IDA & IBRD countries)European UnionFaroe IslandsFijiFinlandFragile and conflict affected situationsFranceFrench PolynesiaGabonGambia, TheGeorgiaGermanyGhanaGibraltarGreeceGreenlandGrenadaGuamGuatemalaGuineaGuinea-BissauGuyanaHaitiHeavily indebted poor countries (HIPC)High incomeHondurasHong Kong SAR, ChinaHungaryIBRD onlyIcelandIDA & IBRD totalIDA blendIDA onlyIDA totalIndiaIndonesiaIran, Islamic Rep.IraqIrelandIsraelItalyJamaicaJapanJordanKazakhstanKenyaKiribatiKorea, Dem. People’s Rep.Korea, Rep.KosovoKuwaitKyrgyz RepublicLao PDRLate-demographic dividendLatin America & Caribbean Latin America & Caribbean (excluding high income)Latin America & the Caribbean (IDA & IBRD countries)LatviaLeast developed countries: UN classificationLebanonLesothoLiberiaLibyaLiechtensteinLithuaniaLow & middle incomeLow incomeLower middle incomeLuxembourgMacao SAR, ChinaMacedonia, FYRMadagascarMalawiMalaysiaMaldivesMaliMaltaMarshall IslandsMauritaniaMauritiusMexicoMicronesia, Fed. Sts.Middle East & North AfricaMiddle East & North Africa (excluding high income)Middle East & North Africa (IDA & IBRD countries)Middle incomeMoldovaMonacoMongoliaMontenegroMoroccoMozambiqueMyanmarNamibiaNauruNepalNetherlandsNew CaledoniaNew ZealandNicaraguaNigerNigeriaNorth AmericaNorthern Mariana IslandsNorwayOECD membersOmanOther small statesPacific island small statesPakistanPalauPanamaPapua New GuineaParaguayPeruPhilippinesPolandPortugalPost-demographic dividendPre-demographic dividendPuerto RicoQatarRomaniaRussian FederationRwandaSamoaSan MarinoSao Tome and PrincipeSaudi ArabiaSenegalSerbiaSeychellesSierra LeoneSingaporeSlovak RepublicSloveniaSmall statesSolomon IslandsSomaliaSouth AfricaSouth AsiaSouth Asia (IDA & IBRD)South SudanSpainSri LankaSt. Kitts and NevisSt. LuciaSt. Vincent and the GrenadinesSub-Saharan Africa Sub-Saharan Africa (excluding high income)Sub-Saharan Africa (IDA & IBRD countries)SudanSurinameSwazilandSwedenSwitzerlandSyrian Arab RepublicTajikistanTanzaniaThailandTimor-LesteTogoTongaTrinidad and TobagoTunisiaTurkeyTurkmenistanTurks and Caicos IslandsTuvaluUgandaUkraineUnited Arab EmiratesUnited KingdomUnited StatesUpper middle incomeUruguayUzbekistanVanuatuVenezuela, RBVietnamVirgin Islands (U.S.)West Bank and GazaWorldYemen, Rep.ZambiaZimbabwe Timeline:
This timeline shows a graph from 1961 to 2016 of Moldova. No data until 1960. Number of actual observations by date: 44.
Source name:
World Development Indicators
Source organization:
International Telecommunication Union, World Telecommunication/ICT Development Report and database.
Categories, topics:
Infrastructure
Last updated:
apr 23, 2017
Indicators value changes by year
Maximum:
35.196
jan 1, 2015
At the date of observation
Value
Absolute change
Change from previous value
jan 1, 1961
0.683
+0.683
0.0%
jan 1, 1966
0.839
+0.157
22.99%
jan 1, 1971
1.441
+0.602
71.67%
jan 1, 1976
3.551
+2.11
146.4%
jan 1, 1977
4.05
+0.499
14.06%
jan 1, 1978
4.51
+0.46
11.36%
jan 1, 1979
4.875
+0.364
8.08%
jan 1, 1980
5.246
+0.371
7.62%
jan 1, 1981
5.638
+0.392
7.48%
jan 1, 1982
5.928
+0.29
5.14%
jan 1, 1983
6.257
+0.329
5.55%
jan 1, 1984
6.522
+0.265
4.23%
jan 1, 1985
6.858
+0.336
5.15%
jan 1, 1986
7.347
+0.489
7.14%
jan 1, 1987
7.81
+0.463
6.3%
jan 1, 1988
8.429
+0.62
7.94%
jan 1, 1989
9.144
+0.715
8.48%
jan 1, 1990
9.822
+0.678
7.41%
jan 1, 1991
10.588
+0.766
7.8%
jan 1, 1992
11.333
+0.745
7.04%
jan 1, 1993
11.669
+0.335
2.96%
jan 1, 1994
11.976
+0.308
2.64%
jan 1, 1995
12.513
+0.536
4.48%
jan 1, 1996
13.055
+0.542
4.33%
jan 1, 1997
13.773
+0.718
5.5%
jan 1, 1998
14.691
+0.919
6.67%
jan 1, 1999
15.573
+0.882
6.0%
jan 1, 2000
13.324
-2.249
-14.44%
jan 1, 2001
14.214
+0.89
6.68%
jan 1, 2002
15.819
+1.604
11.29%
jan 1, 2003
18.122
+2.304
14.56%
jan 1, 2004
20.304
+2.181
12.04%
jan 1, 2005
22.554
+2.251
11.09%
jan 1, 2006
24.672
+2.117
9.39%
jan 1, 2007
27.4
+2.729
11.06%
jan 1, 2008
29.403
+2.003
7.31%
jan 1, 2009
30.649
+1.246
4.24%
jan 1, 2010
31.596
+0.946
3.09%
jan 1, 2011
32.498
+0.902
2.86%
jan 1, 2012
33.304
+0.807
2.48%
jan 1, 2013
34.31
+1.005
3.02%
jan 1, 2014
35.027
+0.718
2.09%
jan 1, 2015
35.196
+0.169
0.48%
jan 1, 2016
34.988
-0.209
-0.59%
Ranking of countries by current statistics by years


Comments: