29
/
en
AIzaSyAYiBZKx7MnpbEhh9jyipgxe19OcubqV5w
April 1, 2024
104847
Chile
CHL
true
2
1
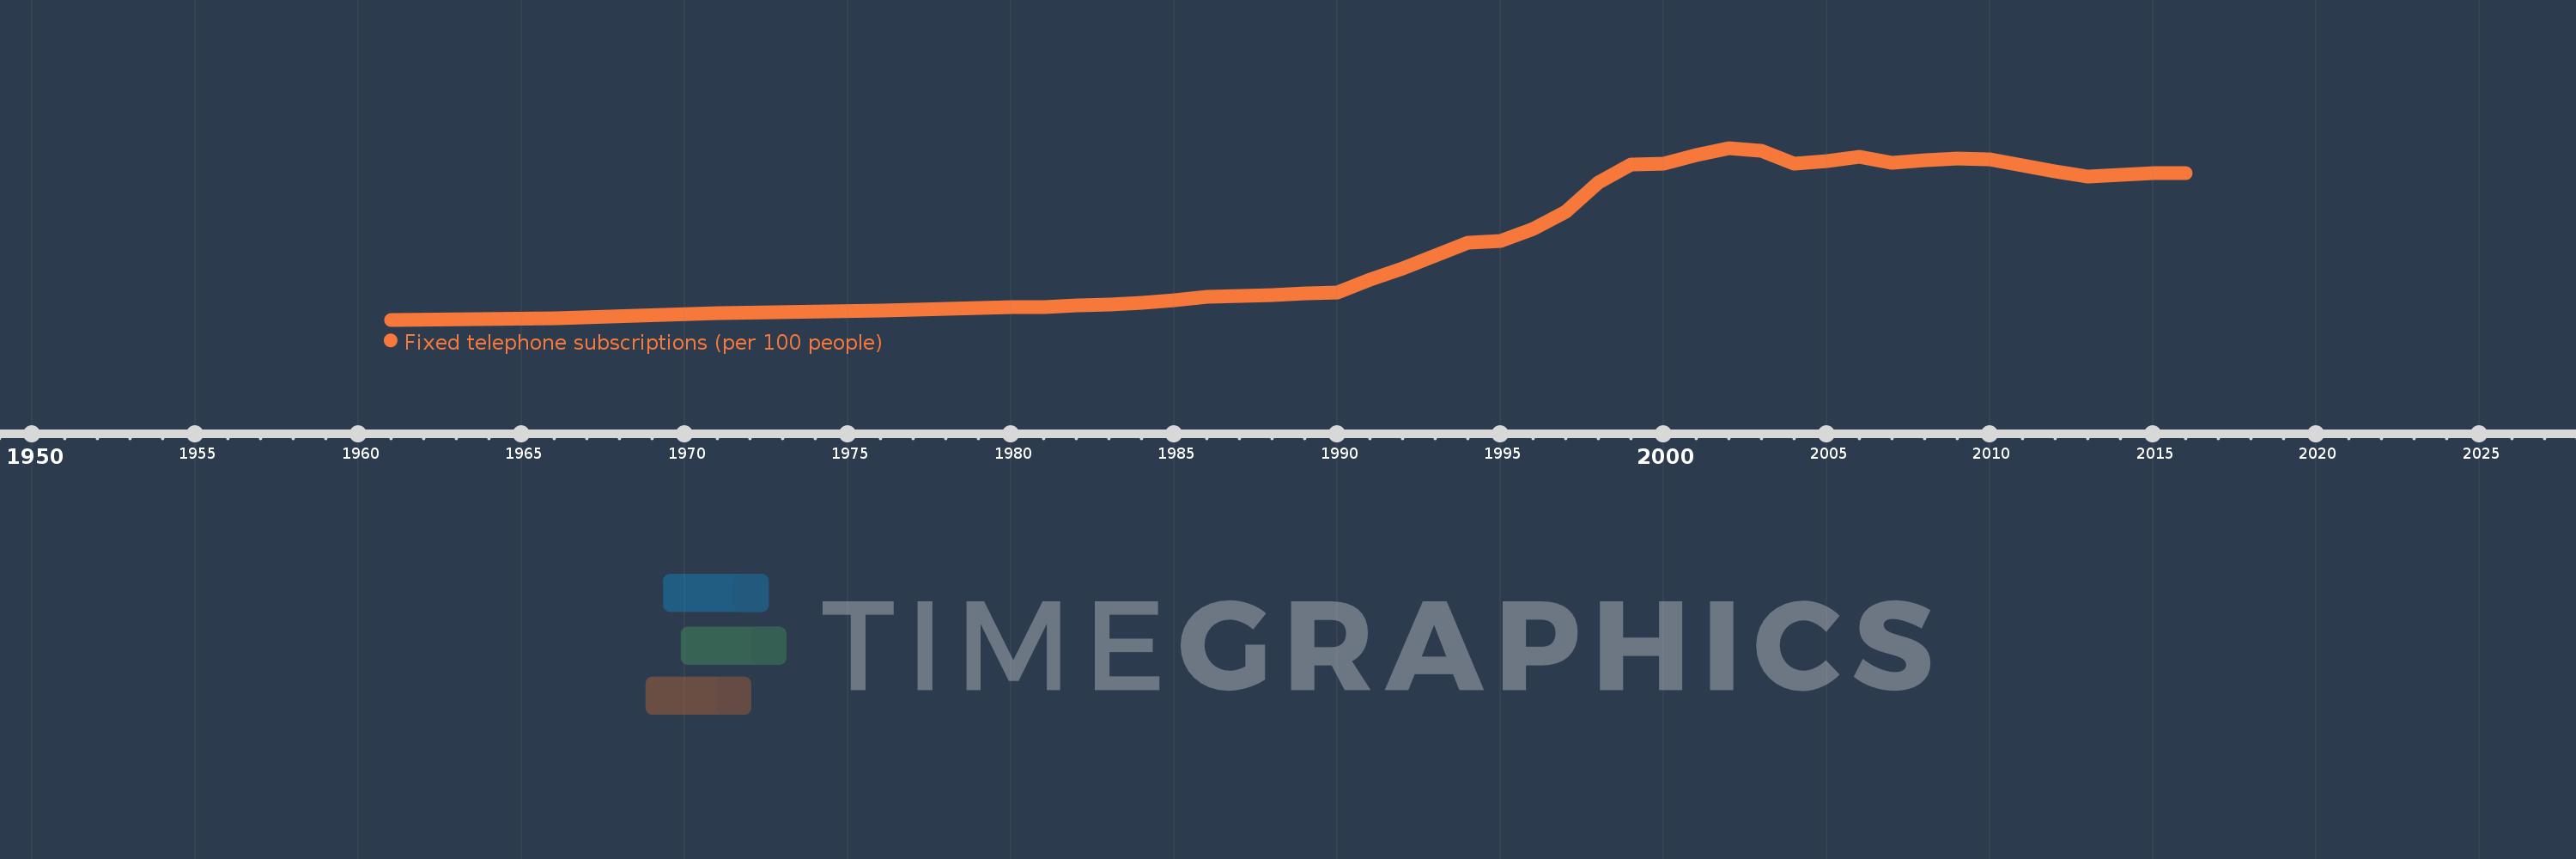
Fixed telephone subscriptions (per 100 people)
2016,2015,2014,2013,2012,2011,2010,2009,2008,2007,2006,2005,2004,2003,2002,2001,2000,1999,1998,1997,1996,1995,1994,1993,1992,1991,1990,1989,1988,1987,1986,1985,1984,1983,1982,1981,1980,1979,1978,1977,1976,1971,1966,1961
This statistics in other country:
AfghanistanAlbaniaAlgeriaAmerican SamoaAndorraAngolaAntigua and BarbudaArab WorldArgentinaArmeniaArubaAustraliaAustriaAzerbaijanBahamas, TheBahrainBangladeshBarbadosBelarusBelgiumBelizeBeninBermudaBhutanBoliviaBosnia and HerzegovinaBotswanaBrazilBritish Virgin IslandsBrunei DarussalamBulgariaBurkina FasoBurundiCabo VerdeCambodiaCameroonCanadaCaribbean small statesCayman IslandsCentral African RepublicCentral Europe and the BalticsChadChileChinaColombiaComorosCongo, Dem. Rep.Congo, Rep.Costa RicaCote d'IvoireCroatiaCubaCuracaoCyprusCzech RepublicDenmarkDjiboutiDominicaDominican RepublicEarly-demographic dividendEast Asia & PacificEast Asia & Pacific (excluding high income)East Asia & Pacific (IDA & IBRD countries)EcuadorEgypt, Arab Rep.El SalvadorEquatorial GuineaEritreaEstoniaEthiopiaEuro areaEurope & Central AsiaEurope & Central Asia (excluding high income)Europe & Central Asia (IDA & IBRD countries)European UnionFaroe IslandsFijiFinlandFragile and conflict affected situationsFranceFrench PolynesiaGabonGambia, TheGeorgiaGermanyGhanaGibraltarGreeceGreenlandGrenadaGuamGuatemalaGuineaGuinea-BissauGuyanaHaitiHeavily indebted poor countries (HIPC)High incomeHondurasHong Kong SAR, ChinaHungaryIBRD onlyIcelandIDA & IBRD totalIDA blendIDA onlyIDA totalIndiaIndonesiaIran, Islamic Rep.IraqIrelandIsraelItalyJamaicaJapanJordanKazakhstanKenyaKiribatiKorea, Dem. People’s Rep.Korea, Rep.KosovoKuwaitKyrgyz RepublicLao PDRLate-demographic dividendLatin America & Caribbean Latin America & Caribbean (excluding high income)Latin America & the Caribbean (IDA & IBRD countries)LatviaLeast developed countries: UN classificationLebanonLesothoLiberiaLibyaLiechtensteinLithuaniaLow & middle incomeLow incomeLower middle incomeLuxembourgMacao SAR, ChinaMacedonia, FYRMadagascarMalawiMalaysiaMaldivesMaliMaltaMarshall IslandsMauritaniaMauritiusMexicoMicronesia, Fed. Sts.Middle East & North AfricaMiddle East & North Africa (excluding high income)Middle East & North Africa (IDA & IBRD countries)Middle incomeMoldovaMonacoMongoliaMontenegroMoroccoMozambiqueMyanmarNamibiaNauruNepalNetherlandsNew CaledoniaNew ZealandNicaraguaNigerNigeriaNorth AmericaNorthern Mariana IslandsNorwayOECD membersOmanOther small statesPacific island small statesPakistanPalauPanamaPapua New GuineaParaguayPeruPhilippinesPolandPortugalPost-demographic dividendPre-demographic dividendPuerto RicoQatarRomaniaRussian FederationRwandaSamoaSan MarinoSao Tome and PrincipeSaudi ArabiaSenegalSerbiaSeychellesSierra LeoneSingaporeSlovak RepublicSloveniaSmall statesSolomon IslandsSomaliaSouth AfricaSouth AsiaSouth Asia (IDA & IBRD)South SudanSpainSri LankaSt. Kitts and NevisSt. LuciaSt. Vincent and the GrenadinesSub-Saharan Africa Sub-Saharan Africa (excluding high income)Sub-Saharan Africa (IDA & IBRD countries)SudanSurinameSwazilandSwedenSwitzerlandSyrian Arab RepublicTajikistanTanzaniaThailandTimor-LesteTogoTongaTrinidad and TobagoTunisiaTurkeyTurkmenistanTurks and Caicos IslandsTuvaluUgandaUkraineUnited Arab EmiratesUnited KingdomUnited StatesUpper middle incomeUruguayUzbekistanVanuatuVenezuela, RBVietnamVirgin Islands (U.S.)West Bank and GazaWorldYemen, Rep.ZambiaZimbabwe Timeline:
This timeline shows a graph from 1961 to 2016 of Chile. No data until 1960. Number of actual observations by date: 44.
Source name:
World Development Indicators
Source organization:
International Telecommunication Union, World Telecommunication/ICT Development Report and database.
Categories, topics:
Infrastructure
Last updated:
apr 23, 2017
Indicators value changes by year
Maximum:
22.242
jan 1, 2002
At the date of observation
Value
Absolute change
Change from previous value
jan 1, 1961
1.723
+1.723
0.0%
jan 1, 1966
1.884
+0.16
9.31%
jan 1, 1971
2.474
+0.591
31.36%
jan 1, 1976
2.849
+0.374
15.13%
jan 1, 1977
2.911
+0.063
2.19%
jan 1, 1978
3.029
+0.118
4.05%
jan 1, 1979
3.171
+0.142
4.7%
jan 1, 1980
3.182
+0.01
0.33%
jan 1, 1981
3.243
+0.061
1.93%
jan 1, 1982
3.403
+0.16
4.93%
jan 1, 1983
3.502
+0.098
2.89%
jan 1, 1984
3.724
+0.222
6.35%
jan 1, 1985
4.033
+0.309
8.3%
jan 1, 1986
4.429
+0.396
9.82%
jan 1, 1987
4.525
+0.096
2.17%
jan 1, 1988
4.631
+0.106
2.35%
jan 1, 1989
4.903
+0.272
5.87%
jan 1, 1990
4.975
+0.073
1.48%
jan 1, 1991
6.54
+1.564
31.44%
jan 1, 1992
7.848
+1.308
20.0%
jan 1, 1993
9.361
+1.513
19.28%
jan 1, 1994
10.892
+1.531
16.35%
jan 1, 1995
11.172
+0.281
2.58%
jan 1, 1996
12.59
+1.418
12.69%
jan 1, 1997
14.67
+2.08
16.52%
jan 1, 1998
18.109
+3.439
23.44%
jan 1, 1999
20.214
+2.105
11.62%
jan 1, 2000
20.365
+0.151
0.75%
jan 1, 2001
21.369
+1.004
4.93%
jan 1, 2002
22.242
+0.873
4.08%
jan 1, 2003
21.916
-0.326
-1.47%
jan 1, 2004
20.331
-1.585
-7.23%
jan 1, 2005
20.689
+0.358
1.76%
jan 1, 2006
21.182
+0.493
2.38%
jan 1, 2007
20.501
-0.681
-3.21%
jan 1, 2008
20.755
+0.254
1.24%
jan 1, 2009
20.942
+0.187
0.9%
jan 1, 2010
20.924
-0.018
-0.09%
jan 1, 2011
20.17
-0.753
-3.6%
jan 1, 2012
19.471
-0.699
-3.47%
jan 1, 2013
18.852
-0.619
-3.18%
jan 1, 2014
18.997
+0.145
0.77%
jan 1, 2015
19.286
+0.289
1.52%
jan 1, 2016
19.225
-0.062
-0.32%
Ranking of countries by current statistics by years


Comments: