29
/
en
AIzaSyAYiBZKx7MnpbEhh9jyipgxe19OcubqV5w
April 1, 2024
204110
Myanmar
MMR
true
2
1
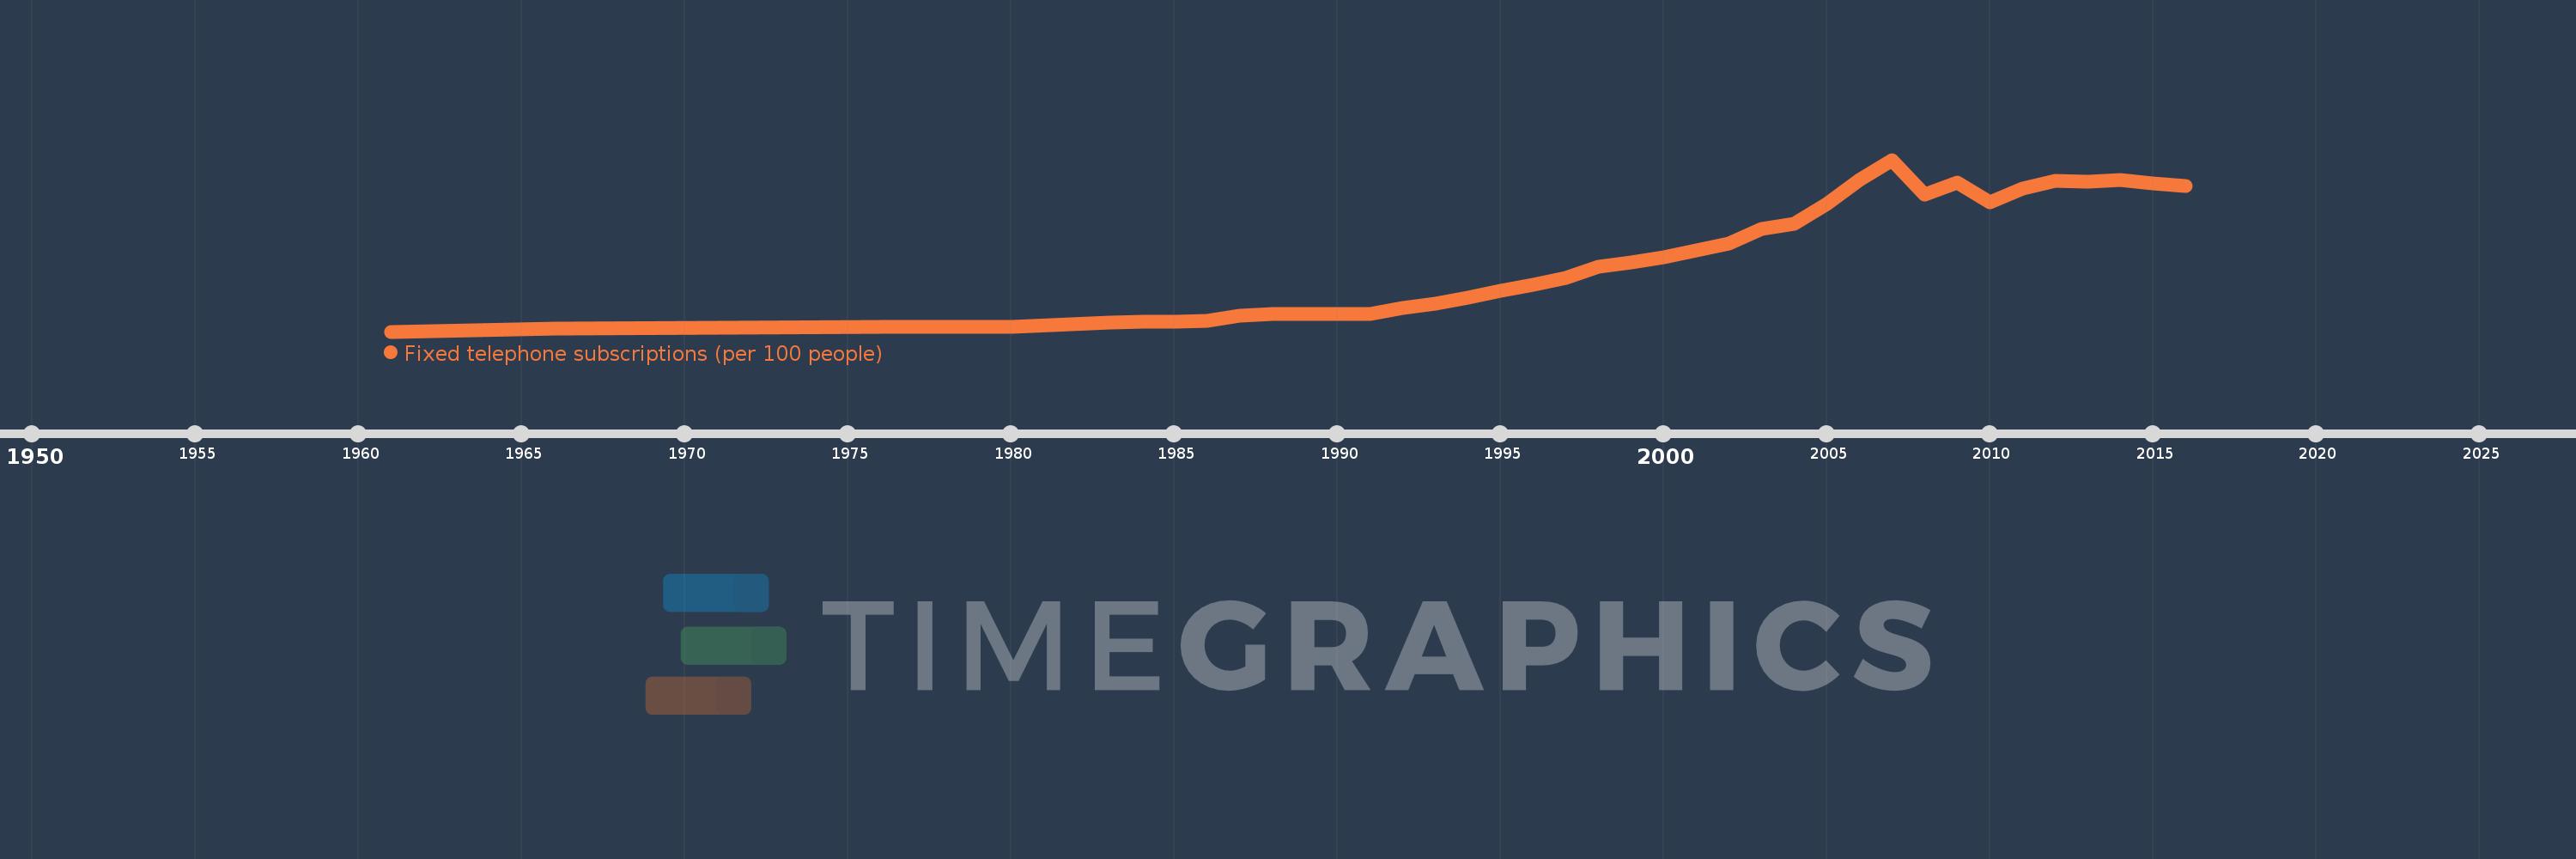
Fixed telephone subscriptions (per 100 people)
2016,2015,2014,2013,2012,2011,2010,2009,2008,2007,2006,2005,2004,2003,2002,2001,2000,1999,1998,1997,1996,1995,1994,1993,1992,1991,1990,1989,1988,1987,1986,1985,1984,1983,1980,1979,1978,1977,1976,1971,1966,1961
This statistics in other country:
AfghanistanAlbaniaAlgeriaAmerican SamoaAndorraAngolaAntigua and BarbudaArab WorldArgentinaArmeniaArubaAustraliaAustriaAzerbaijanBahamas, TheBahrainBangladeshBarbadosBelarusBelgiumBelizeBeninBermudaBhutanBoliviaBosnia and HerzegovinaBotswanaBrazilBritish Virgin IslandsBrunei DarussalamBulgariaBurkina FasoBurundiCabo VerdeCambodiaCameroonCanadaCaribbean small statesCayman IslandsCentral African RepublicCentral Europe and the BalticsChadChileChinaColombiaComorosCongo, Dem. Rep.Congo, Rep.Costa RicaCote d'IvoireCroatiaCubaCuracaoCyprusCzech RepublicDenmarkDjiboutiDominicaDominican RepublicEarly-demographic dividendEast Asia & PacificEast Asia & Pacific (excluding high income)East Asia & Pacific (IDA & IBRD countries)EcuadorEgypt, Arab Rep.El SalvadorEquatorial GuineaEritreaEstoniaEthiopiaEuro areaEurope & Central AsiaEurope & Central Asia (excluding high income)Europe & Central Asia (IDA & IBRD countries)European UnionFaroe IslandsFijiFinlandFragile and conflict affected situationsFranceFrench PolynesiaGabonGambia, TheGeorgiaGermanyGhanaGibraltarGreeceGreenlandGrenadaGuamGuatemalaGuineaGuinea-BissauGuyanaHaitiHeavily indebted poor countries (HIPC)High incomeHondurasHong Kong SAR, ChinaHungaryIBRD onlyIcelandIDA & IBRD totalIDA blendIDA onlyIDA totalIndiaIndonesiaIran, Islamic Rep.IraqIrelandIsraelItalyJamaicaJapanJordanKazakhstanKenyaKiribatiKorea, Dem. People’s Rep.Korea, Rep.KosovoKuwaitKyrgyz RepublicLao PDRLate-demographic dividendLatin America & Caribbean Latin America & Caribbean (excluding high income)Latin America & the Caribbean (IDA & IBRD countries)LatviaLeast developed countries: UN classificationLebanonLesothoLiberiaLibyaLiechtensteinLithuaniaLow & middle incomeLow incomeLower middle incomeLuxembourgMacao SAR, ChinaMacedonia, FYRMadagascarMalawiMalaysiaMaldivesMaliMaltaMarshall IslandsMauritaniaMauritiusMexicoMicronesia, Fed. Sts.Middle East & North AfricaMiddle East & North Africa (excluding high income)Middle East & North Africa (IDA & IBRD countries)Middle incomeMoldovaMonacoMongoliaMontenegroMoroccoMozambiqueMyanmarNamibiaNauruNepalNetherlandsNew CaledoniaNew ZealandNicaraguaNigerNigeriaNorth AmericaNorthern Mariana IslandsNorwayOECD membersOmanOther small statesPacific island small statesPakistanPalauPanamaPapua New GuineaParaguayPeruPhilippinesPolandPortugalPost-demographic dividendPre-demographic dividendPuerto RicoQatarRomaniaRussian FederationRwandaSamoaSan MarinoSao Tome and PrincipeSaudi ArabiaSenegalSerbiaSeychellesSierra LeoneSingaporeSlovak RepublicSloveniaSmall statesSolomon IslandsSomaliaSouth AfricaSouth AsiaSouth Asia (IDA & IBRD)South SudanSpainSri LankaSt. Kitts and NevisSt. LuciaSt. Vincent and the GrenadinesSub-Saharan Africa Sub-Saharan Africa (excluding high income)Sub-Saharan Africa (IDA & IBRD countries)SudanSurinameSwazilandSwedenSwitzerlandSyrian Arab RepublicTajikistanTanzaniaThailandTimor-LesteTogoTongaTrinidad and TobagoTunisiaTurkeyTurkmenistanTurks and Caicos IslandsTuvaluUgandaUkraineUnited Arab EmiratesUnited KingdomUnited StatesUpper middle incomeUruguayUzbekistanVanuatuVenezuela, RBVietnamVirgin Islands (U.S.)West Bank and GazaWorldYemen, Rep.ZambiaZimbabwe Timeline:
This timeline shows a graph from 1961 to 2016 of Myanmar. No data until 1960. Number of actual observations by date: 42.
Source name:
World Development Indicators
Source organization:
International Telecommunication Union, World Telecommunication/ICT Development Report and database.
Categories, topics:
Infrastructure
Last updated:
apr 23, 2017
Indicators value changes by year
At the date of observation
Value
Absolute change
Change from previous value
jan 1, 1961
0.053
+0.053
0.0%
jan 1, 1966
0.073
+0.02
37.17%
jan 1, 1971
0.076
+0.003
4.01%
jan 1, 1976
0.083
+0.007
8.79%
jan 1, 1977
0.083
0.0
-0.43%
jan 1, 1978
0.082
0.0
-0.08%
jan 1, 1979
0.083
+0.0
0.25%
jan 1, 1980
0.084
+0.001
1.27%
jan 1, 1983
0.108
+0.024
28.96%
jan 1, 1984
0.114
+0.006
5.97%
jan 1, 1985
0.114
-0.001
-0.48%
jan 1, 1986
0.123
+0.009
8.23%
jan 1, 1987
0.151
+0.028
22.48%
jan 1, 1988
0.164
+0.013
8.48%
jan 1, 1989
0.164
0.0
-0.06%
jan 1, 1990
0.162
-0.002
-1.21%
jan 1, 1991
0.166
+0.005
2.9%
jan 1, 1992
0.201
+0.035
20.74%
jan 1, 1993
0.228
+0.027
13.57%
jan 1, 1994
0.266
+0.038
16.74%
jan 1, 1995
0.307
+0.041
15.39%
jan 1, 1996
0.348
+0.041
13.3%
jan 1, 1997
0.388
+0.04
11.54%
jan 1, 1998
0.458
+0.069
17.81%
jan 1, 1999
0.485
+0.027
5.91%
jan 1, 2000
0.52
+0.035
7.25%
jan 1, 2001
0.56
+0.04
7.76%
jan 1, 2002
0.604
+0.044
7.82%
jan 1, 2003
0.695
+0.091
15.08%
jan 1, 2004
0.732
+0.037
5.36%
jan 1, 2005
0.852
+0.12
16.35%
jan 1, 2006
1.004
+0.152
17.88%
jan 1, 2007
1.131
+0.127
12.65%
jan 1, 2008
0.913
-0.218
-19.29%
jan 1, 2009
0.986
+0.073
7.96%
jan 1, 2010
0.862
-0.124
-12.56%
jan 1, 2011
0.95
+0.088
10.2%
jan 1, 2012
1.001
+0.051
5.34%
jan 1, 2013
0.993
-0.008
-0.78%
jan 1, 2014
1.004
+0.011
1.13%
jan 1, 2015
0.981
-0.024
-2.34%
jan 1, 2016
0.967
-0.014
-1.4%
Ranking of countries by current statistics by years


Comments: