29
/
en
AIzaSyAYiBZKx7MnpbEhh9jyipgxe19OcubqV5w
April 1, 2024
206067
Nauru
NRU
true
2
1
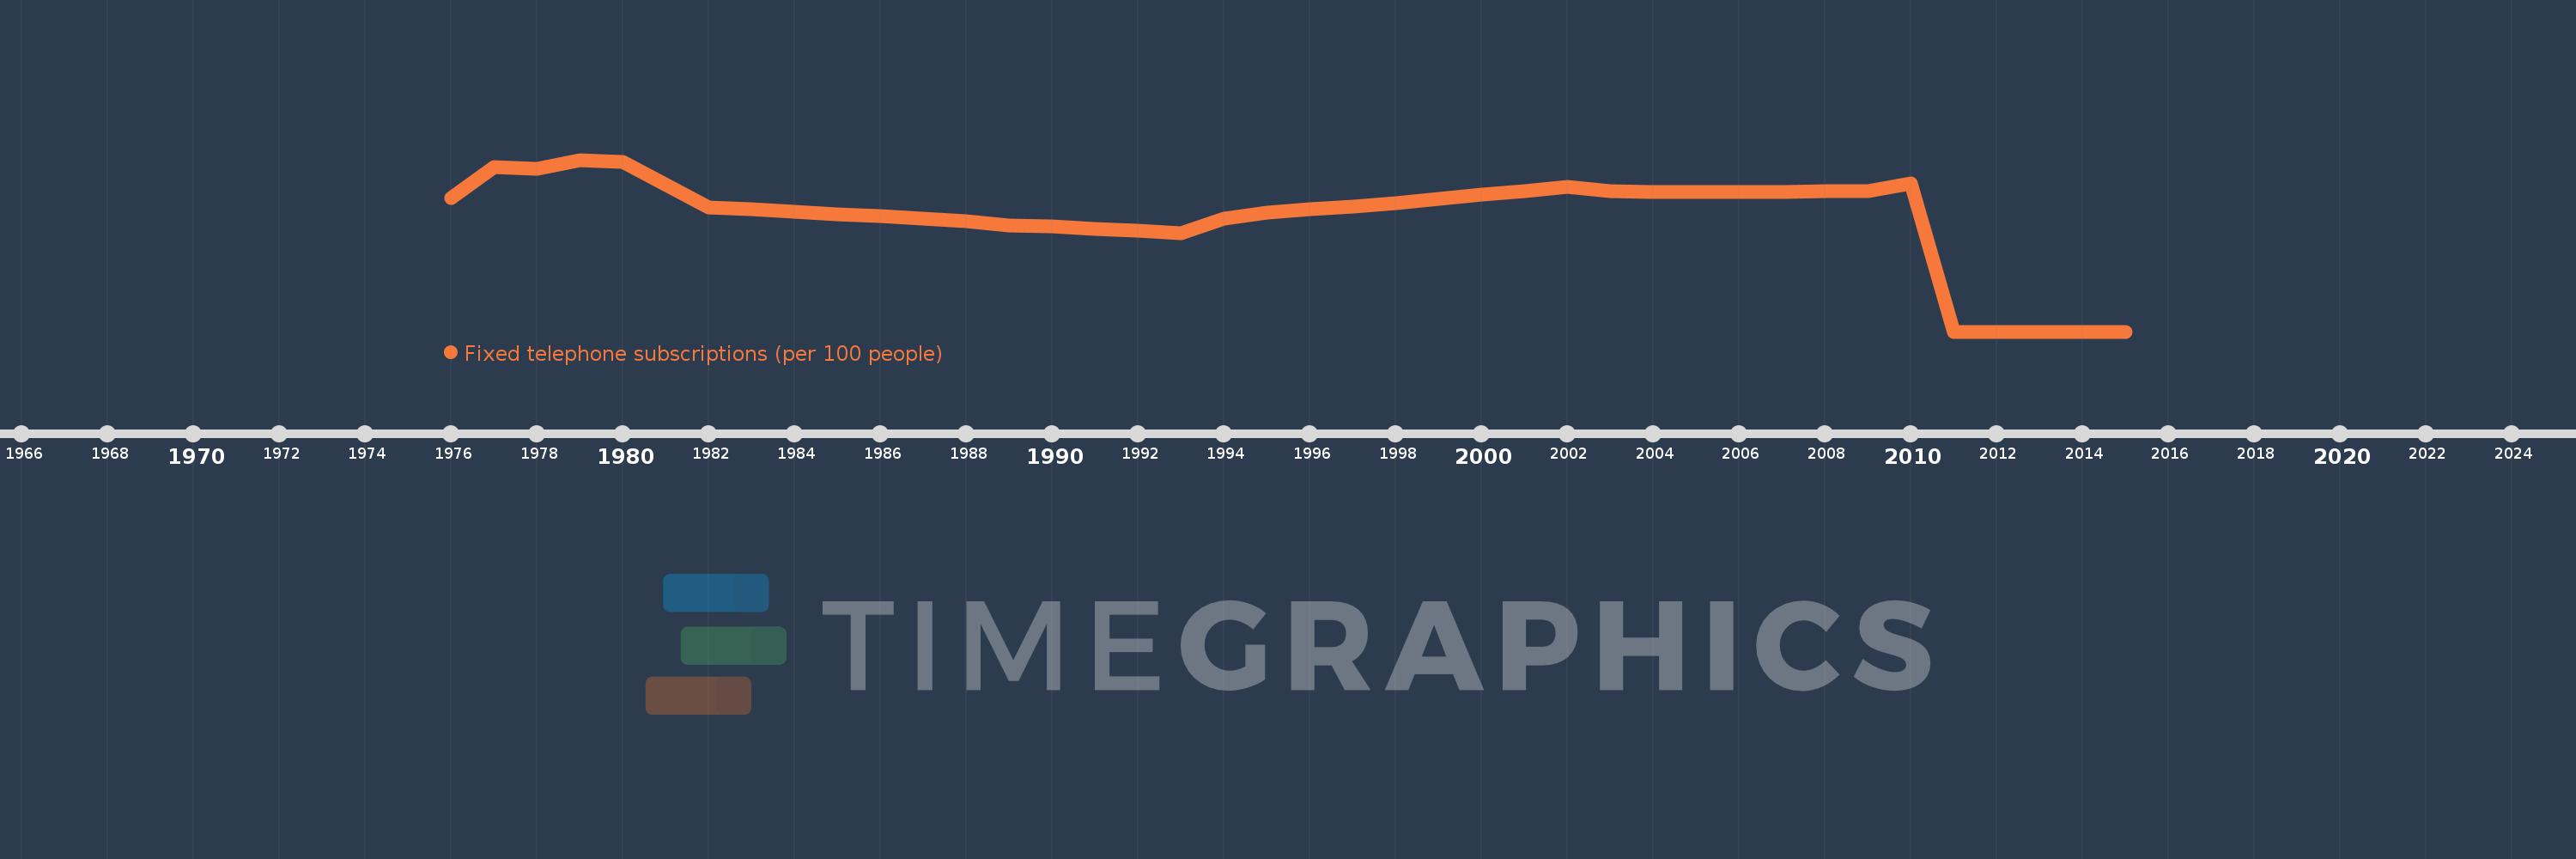
Fixed telephone subscriptions (per 100 people)
2015,2014,2013,2012,2011,2010,2009,2008,2007,2006,2005,2004,2003,2002,2001,2000,1999,1998,1997,1996,1995,1994,1993,1992,1991,1990,1989,1988,1987,1986,1985,1984,1983,1982,1980,1979,1978,1977,1976
This statistics in other country:
AfghanistanAlbaniaAlgeriaAmerican SamoaAndorraAngolaAntigua and BarbudaArab WorldArgentinaArmeniaArubaAustraliaAustriaAzerbaijanBahamas, TheBahrainBangladeshBarbadosBelarusBelgiumBelizeBeninBermudaBhutanBoliviaBosnia and HerzegovinaBotswanaBrazilBritish Virgin IslandsBrunei DarussalamBulgariaBurkina FasoBurundiCabo VerdeCambodiaCameroonCanadaCaribbean small statesCayman IslandsCentral African RepublicCentral Europe and the BalticsChadChileChinaColombiaComorosCongo, Dem. Rep.Congo, Rep.Costa RicaCote d'IvoireCroatiaCubaCuracaoCyprusCzech RepublicDenmarkDjiboutiDominicaDominican RepublicEarly-demographic dividendEast Asia & PacificEast Asia & Pacific (excluding high income)East Asia & Pacific (IDA & IBRD countries)EcuadorEgypt, Arab Rep.El SalvadorEquatorial GuineaEritreaEstoniaEthiopiaEuro areaEurope & Central AsiaEurope & Central Asia (excluding high income)Europe & Central Asia (IDA & IBRD countries)European UnionFaroe IslandsFijiFinlandFragile and conflict affected situationsFranceFrench PolynesiaGabonGambia, TheGeorgiaGermanyGhanaGibraltarGreeceGreenlandGrenadaGuamGuatemalaGuineaGuinea-BissauGuyanaHaitiHeavily indebted poor countries (HIPC)High incomeHondurasHong Kong SAR, ChinaHungaryIBRD onlyIcelandIDA & IBRD totalIDA blendIDA onlyIDA totalIndiaIndonesiaIran, Islamic Rep.IraqIrelandIsraelItalyJamaicaJapanJordanKazakhstanKenyaKiribatiKorea, Dem. People’s Rep.Korea, Rep.KosovoKuwaitKyrgyz RepublicLao PDRLate-demographic dividendLatin America & Caribbean Latin America & Caribbean (excluding high income)Latin America & the Caribbean (IDA & IBRD countries)LatviaLeast developed countries: UN classificationLebanonLesothoLiberiaLibyaLiechtensteinLithuaniaLow & middle incomeLow incomeLower middle incomeLuxembourgMacao SAR, ChinaMacedonia, FYRMadagascarMalawiMalaysiaMaldivesMaliMaltaMarshall IslandsMauritaniaMauritiusMexicoMicronesia, Fed. Sts.Middle East & North AfricaMiddle East & North Africa (excluding high income)Middle East & North Africa (IDA & IBRD countries)Middle incomeMoldovaMonacoMongoliaMontenegroMoroccoMozambiqueMyanmarNamibiaNauruNepalNetherlandsNew CaledoniaNew ZealandNicaraguaNigerNigeriaNorth AmericaNorthern Mariana IslandsNorwayOECD membersOmanOther small statesPacific island small statesPakistanPalauPanamaPapua New GuineaParaguayPeruPhilippinesPolandPortugalPost-demographic dividendPre-demographic dividendPuerto RicoQatarRomaniaRussian FederationRwandaSamoaSan MarinoSao Tome and PrincipeSaudi ArabiaSenegalSerbiaSeychellesSierra LeoneSingaporeSlovak RepublicSloveniaSmall statesSolomon IslandsSomaliaSouth AfricaSouth AsiaSouth Asia (IDA & IBRD)South SudanSpainSri LankaSt. Kitts and NevisSt. LuciaSt. Vincent and the GrenadinesSub-Saharan Africa Sub-Saharan Africa (excluding high income)Sub-Saharan Africa (IDA & IBRD countries)SudanSurinameSwazilandSwedenSwitzerlandSyrian Arab RepublicTajikistanTanzaniaThailandTimor-LesteTogoTongaTrinidad and TobagoTunisiaTurkeyTurkmenistanTurks and Caicos IslandsTuvaluUgandaUkraineUnited Arab EmiratesUnited KingdomUnited StatesUpper middle incomeUruguayUzbekistanVanuatuVenezuela, RBVietnamVirgin Islands (U.S.)West Bank and GazaWorldYemen, Rep.ZambiaZimbabwe Timeline:
This timeline shows a graph from 1976 to 2015 of Nauru. No data until 1975. Number of actual observations by date: 39.
Source name:
World Development Indicators
Source organization:
International Telecommunication Union, World Telecommunication/ICT Development Report and database.
Categories, topics:
Infrastructure
Last updated:
apr 23, 2017
Indicators value changes by year
Maximum:
21.885
jan 1, 1979
At the date of observation
Value
Absolute change
Change from previous value
jan 1, 1976
16.973
+16.973
0.0%
jan 1, 1977
20.961
+3.988
23.5%
jan 1, 1978
20.733
-0.229
-1.09%
jan 1, 1979
21.885
+1.152
5.56%
jan 1, 1980
21.642
-0.243
-1.11%
jan 1, 1982
15.796
-5.846
-27.01%
jan 1, 1983
15.546
-0.25
-1.58%
jan 1, 1984
15.277
-0.269
-1.73%
jan 1, 1985
14.987
-0.29
-1.9%
jan 1, 1986
14.681
-0.306
-2.04%
jan 1, 1987
14.361
-0.32
-2.18%
jan 1, 1988
14.035
-0.326
-2.27%
jan 1, 1989
13.483
-0.552
-3.94%
jan 1, 1990
13.399
-0.084
-0.62%
jan 1, 1991
13.105
-0.294
-2.2%
jan 1, 1992
12.829
-0.276
-2.11%
jan 1, 1993
12.573
-0.255
-1.99%
jan 1, 1994
14.405
+1.831
14.57%
jan 1, 1995
15.208
+0.804
5.58%
jan 1, 1996
15.547
+0.338
2.22%
jan 1, 1997
15.947
+0.401
2.58%
jan 1, 1998
16.408
+0.461
2.89%
jan 1, 1999
16.909
+0.501
3.05%
jan 1, 2000
17.423
+0.515
3.04%
jan 1, 2001
17.925
+0.501
2.88%
jan 1, 2002
18.402
+0.478
2.67%
jan 1, 2003
17.871
-0.531
-2.89%
jan 1, 2004
17.829
-0.042
-0.24%
jan 1, 2005
17.801
-0.028
-0.16%
jan 1, 2006
17.795
-0.005
-0.03%
jan 1, 2007
17.815
+0.019
0.11%
jan 1, 2008
17.852
+0.037
0.21%
jan 1, 2009
17.896
+0.044
0.25%
jan 1, 2010
18.93
+1.034
5.78%
jan 1, 2011
0.0
-18.93
-100.0%
Ranking of countries by current statistics by years


Comments: