29
/
en
AIzaSyAYiBZKx7MnpbEhh9jyipgxe19OcubqV5w
April 1, 2024
64686
Albania
ALB
true
2
1
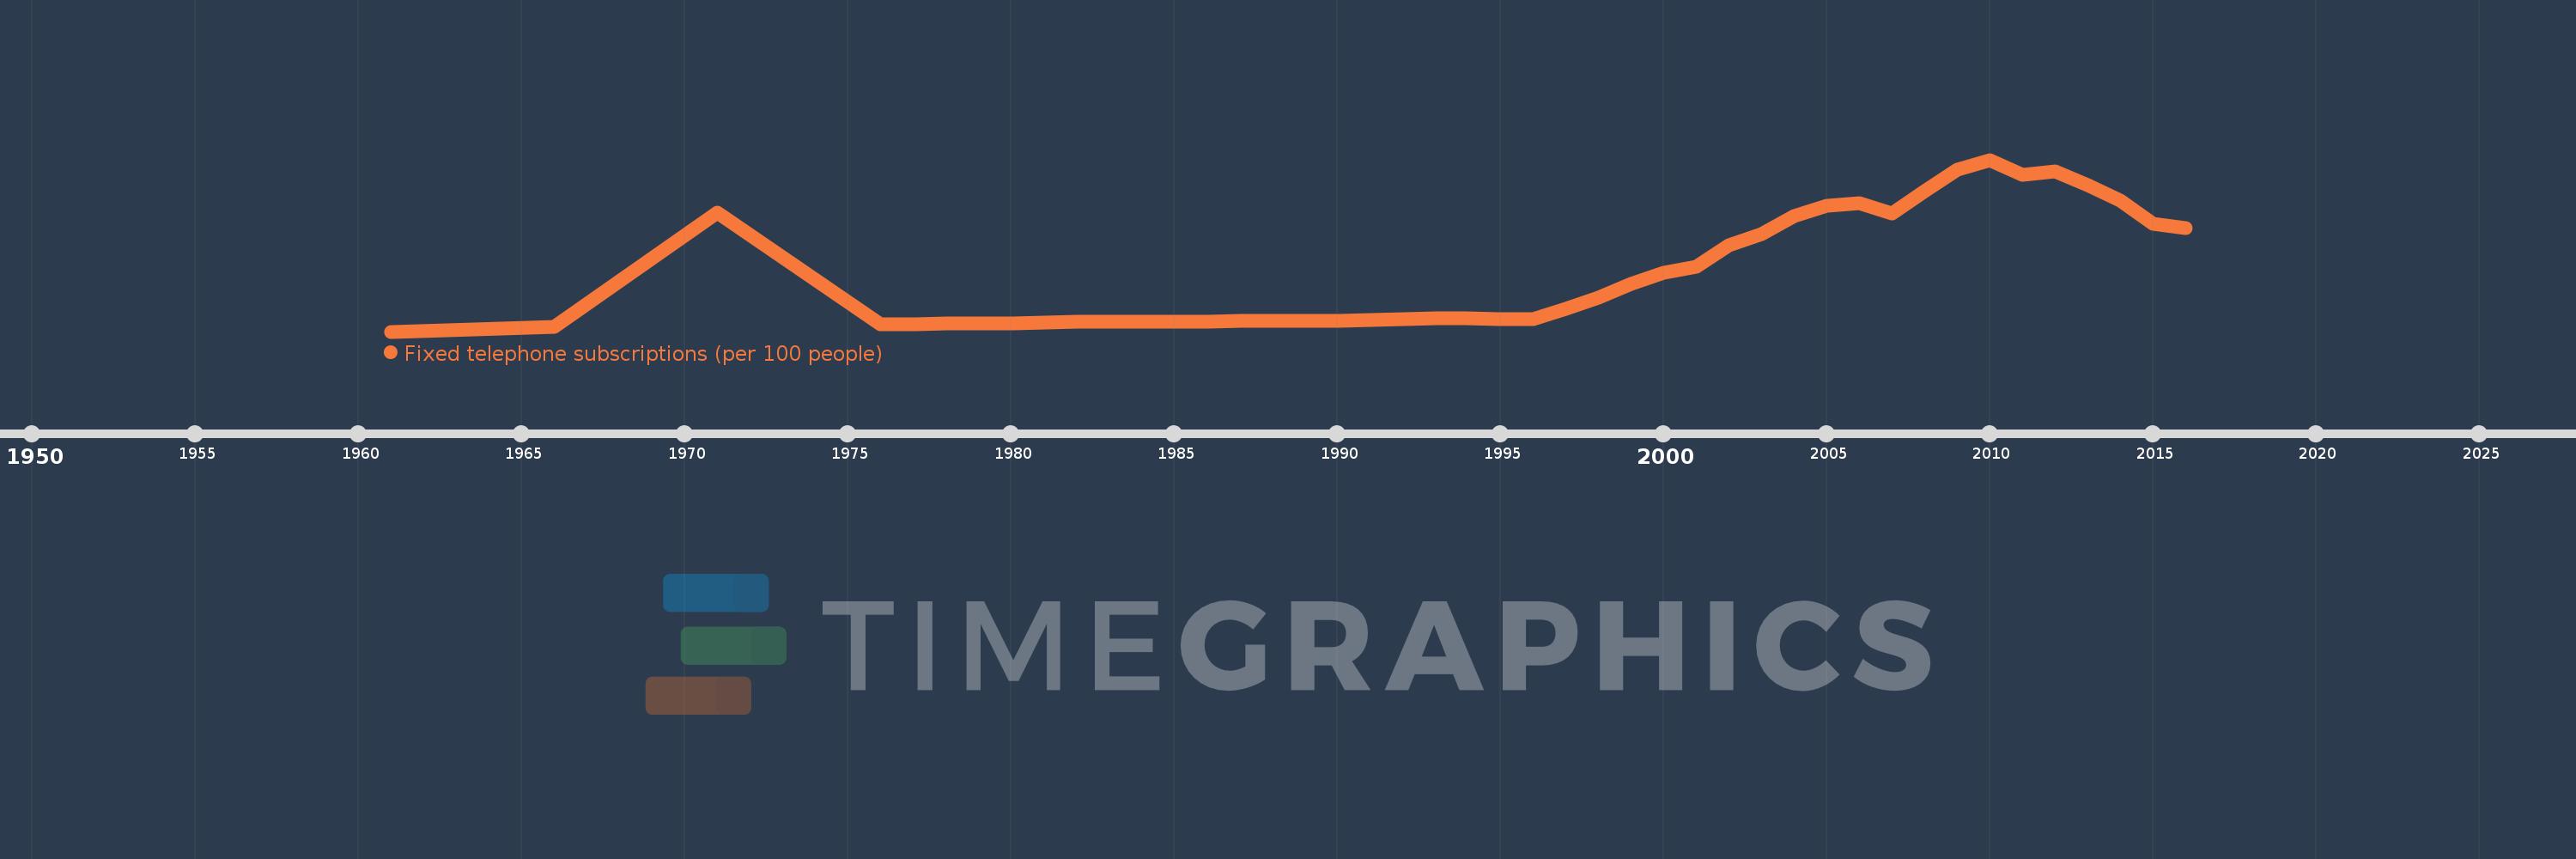
Fixed telephone subscriptions (per 100 people)
2016,2015,2014,2013,2012,2011,2010,2009,2008,2007,2006,2005,2004,2003,2002,2001,2000,1999,1998,1997,1996,1995,1994,1993,1992,1991,1990,1989,1988,1987,1986,1985,1984,1983,1982,1981,1980,1979,1978,1977,1976,1971,1966,1961
This statistics in other country:
AfghanistanAlbaniaAlgeriaAmerican SamoaAndorraAngolaAntigua and BarbudaArab WorldArgentinaArmeniaArubaAustraliaAustriaAzerbaijanBahamas, TheBahrainBangladeshBarbadosBelarusBelgiumBelizeBeninBermudaBhutanBoliviaBosnia and HerzegovinaBotswanaBrazilBritish Virgin IslandsBrunei DarussalamBulgariaBurkina FasoBurundiCabo VerdeCambodiaCameroonCanadaCaribbean small statesCayman IslandsCentral African RepublicCentral Europe and the BalticsChadChileChinaColombiaComorosCongo, Dem. Rep.Congo, Rep.Costa RicaCote d'IvoireCroatiaCubaCuracaoCyprusCzech RepublicDenmarkDjiboutiDominicaDominican RepublicEarly-demographic dividendEast Asia & PacificEast Asia & Pacific (excluding high income)East Asia & Pacific (IDA & IBRD countries)EcuadorEgypt, Arab Rep.El SalvadorEquatorial GuineaEritreaEstoniaEthiopiaEuro areaEurope & Central AsiaEurope & Central Asia (excluding high income)Europe & Central Asia (IDA & IBRD countries)European UnionFaroe IslandsFijiFinlandFragile and conflict affected situationsFranceFrench PolynesiaGabonGambia, TheGeorgiaGermanyGhanaGibraltarGreeceGreenlandGrenadaGuamGuatemalaGuineaGuinea-BissauGuyanaHaitiHeavily indebted poor countries (HIPC)High incomeHondurasHong Kong SAR, ChinaHungaryIBRD onlyIcelandIDA & IBRD totalIDA blendIDA onlyIDA totalIndiaIndonesiaIran, Islamic Rep.IraqIrelandIsraelItalyJamaicaJapanJordanKazakhstanKenyaKiribatiKorea, Dem. People’s Rep.Korea, Rep.KosovoKuwaitKyrgyz RepublicLao PDRLate-demographic dividendLatin America & Caribbean Latin America & Caribbean (excluding high income)Latin America & the Caribbean (IDA & IBRD countries)LatviaLeast developed countries: UN classificationLebanonLesothoLiberiaLibyaLiechtensteinLithuaniaLow & middle incomeLow incomeLower middle incomeLuxembourgMacao SAR, ChinaMacedonia, FYRMadagascarMalawiMalaysiaMaldivesMaliMaltaMarshall IslandsMauritaniaMauritiusMexicoMicronesia, Fed. Sts.Middle East & North AfricaMiddle East & North Africa (excluding high income)Middle East & North Africa (IDA & IBRD countries)Middle incomeMoldovaMonacoMongoliaMontenegroMoroccoMozambiqueMyanmarNamibiaNauruNepalNetherlandsNew CaledoniaNew ZealandNicaraguaNigerNigeriaNorth AmericaNorthern Mariana IslandsNorwayOECD membersOmanOther small statesPacific island small statesPakistanPalauPanamaPapua New GuineaParaguayPeruPhilippinesPolandPortugalPost-demographic dividendPre-demographic dividendPuerto RicoQatarRomaniaRussian FederationRwandaSamoaSan MarinoSao Tome and PrincipeSaudi ArabiaSenegalSerbiaSeychellesSierra LeoneSingaporeSlovak RepublicSloveniaSmall statesSolomon IslandsSomaliaSouth AfricaSouth AsiaSouth Asia (IDA & IBRD)South SudanSpainSri LankaSt. Kitts and NevisSt. LuciaSt. Vincent and the GrenadinesSub-Saharan Africa Sub-Saharan Africa (excluding high income)Sub-Saharan Africa (IDA & IBRD countries)SudanSurinameSwazilandSwedenSwitzerlandSyrian Arab RepublicTajikistanTanzaniaThailandTimor-LesteTogoTongaTrinidad and TobagoTunisiaTurkeyTurkmenistanTurks and Caicos IslandsTuvaluUgandaUkraineUnited Arab EmiratesUnited KingdomUnited StatesUpper middle incomeUruguayUzbekistanVanuatuVenezuela, RBVietnamVirgin Islands (U.S.)West Bank and GazaWorldYemen, Rep.ZambiaZimbabwe Timeline:
This timeline shows a graph from 1961 to 2016 of Albania. No data until 1960. Number of actual observations by date: 44.
Source name:
World Development Indicators
Source organization:
International Telecommunication Union, World Telecommunication/ICT Development Report and database.
Categories, topics:
Infrastructure
Last updated:
apr 23, 2017
Indicators value changes by year
Maximum:
11.519
jan 1, 2010
At the date of observation
Value
Absolute change
Change from previous value
jan 1, 1961
0.423
+0.423
0.0%
jan 1, 1966
0.746
+0.324
76.54%
jan 1, 1971
8.088
+7.342
983.51%
jan 1, 1976
0.893
-7.195
-88.96%
jan 1, 1977
0.905
+0.012
1.39%
jan 1, 1978
0.935
+0.03
3.27%
jan 1, 1979
0.947
+0.013
1.34%
jan 1, 1980
0.974
+0.026
2.79%
jan 1, 1981
0.998
+0.025
2.53%
jan 1, 1982
1.036
+0.038
3.78%
jan 1, 1983
1.048
+0.012
1.12%
jan 1, 1984
1.058
+0.01
0.99%
jan 1, 1985
1.066
+0.008
0.78%
jan 1, 1986
1.081
+0.015
1.4%
jan 1, 1987
1.107
+0.026
2.38%
jan 1, 1988
1.107
+0.0
0.03%
jan 1, 1989
1.109
+0.002
0.16%
jan 1, 1990
1.132
+0.023
2.11%
jan 1, 1991
1.16
+0.028
2.48%
jan 1, 1992
1.2
+0.039
3.36%
jan 1, 1993
1.301
+0.102
8.47%
jan 1, 1994
1.258
-0.043
-3.29%
jan 1, 1995
1.226
-0.032
-2.55%
jan 1, 1996
1.255
+0.029
2.37%
jan 1, 1997
1.911
+0.656
52.25%
jan 1, 1998
2.606
+0.694
36.34%
jan 1, 1999
3.478
+0.873
33.5%
jan 1, 2000
4.231
+0.753
21.64%
jan 1, 2001
4.62
+0.389
9.19%
jan 1, 2002
6.01
+1.39
30.09%
jan 1, 2003
6.741
+0.731
12.16%
jan 1, 2004
7.872
+1.131
16.78%
jan 1, 2005
8.537
+0.665
8.45%
jan 1, 2006
8.728
+0.192
2.25%
jan 1, 2007
8.051
-0.677
-7.76%
jan 1, 2008
9.475
+1.424
17.68%
jan 1, 2009
10.885
+1.41
14.88%
jan 1, 2010
11.519
+0.635
5.83%
jan 1, 2011
10.573
-0.946
-8.22%
jan 1, 2012
10.744
+0.171
1.61%
jan 1, 2013
9.867
-0.877
-8.16%
jan 1, 2014
8.862
-1.005
-10.19%
jan 1, 2015
7.4
-1.461
-16.49%
jan 1, 2016
7.092
-0.309
-4.17%
Ranking of countries by current statistics by years


Comments: