29
/
en
AIzaSyAYiBZKx7MnpbEhh9jyipgxe19OcubqV5w
April 1, 2024
123470
Ecuador
ECU
true
2
1
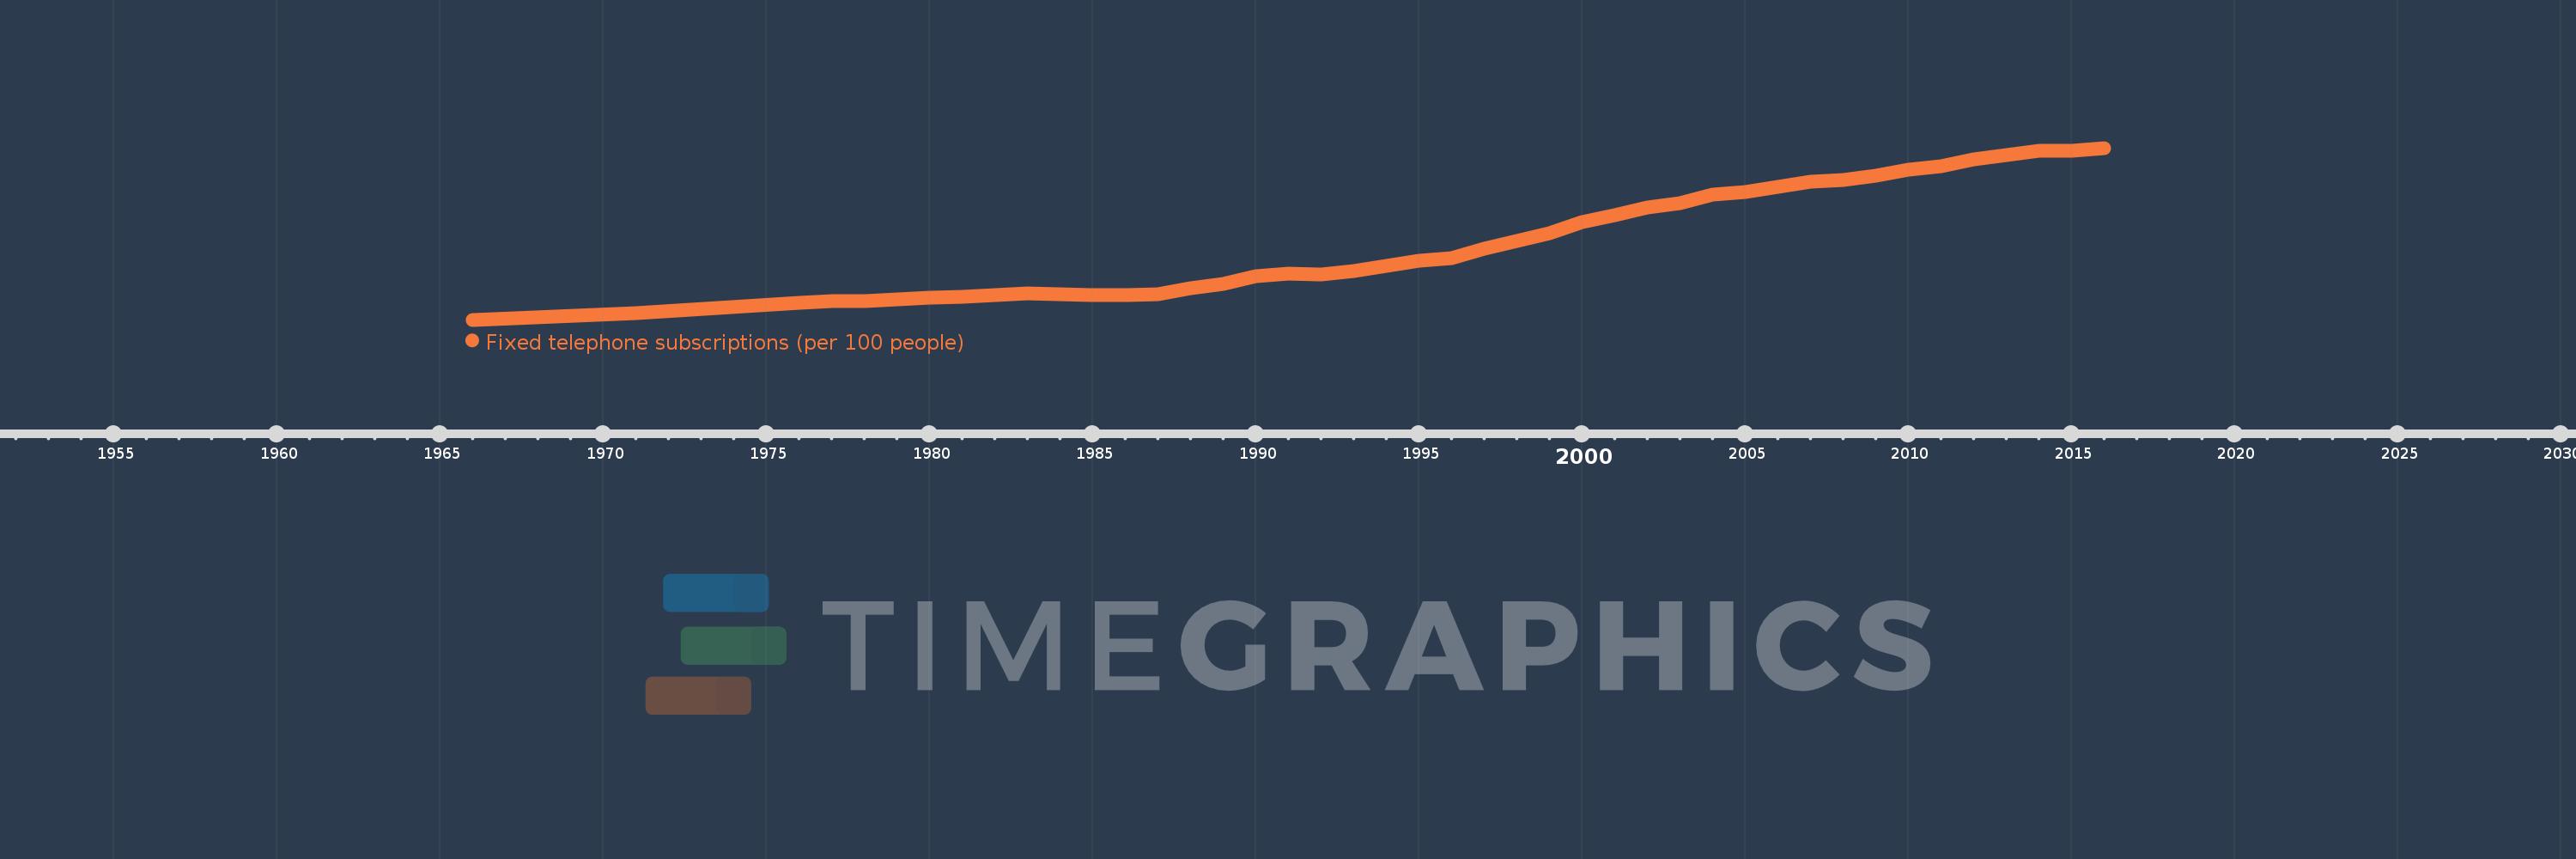
Fixed telephone subscriptions (per 100 people)
2016,2015,2014,2013,2012,2011,2010,2009,2008,2007,2006,2005,2004,2003,2002,2001,2000,1999,1998,1997,1996,1995,1994,1993,1992,1991,1990,1989,1988,1987,1986,1985,1984,1983,1982,1981,1980,1979,1978,1977,1976,1971,1966
This statistics in other country:
AfghanistanAlbaniaAlgeriaAmerican SamoaAndorraAngolaAntigua and BarbudaArab WorldArgentinaArmeniaArubaAustraliaAustriaAzerbaijanBahamas, TheBahrainBangladeshBarbadosBelarusBelgiumBelizeBeninBermudaBhutanBoliviaBosnia and HerzegovinaBotswanaBrazilBritish Virgin IslandsBrunei DarussalamBulgariaBurkina FasoBurundiCabo VerdeCambodiaCameroonCanadaCaribbean small statesCayman IslandsCentral African RepublicCentral Europe and the BalticsChadChileChinaColombiaComorosCongo, Dem. Rep.Congo, Rep.Costa RicaCote d'IvoireCroatiaCubaCuracaoCyprusCzech RepublicDenmarkDjiboutiDominicaDominican RepublicEarly-demographic dividendEast Asia & PacificEast Asia & Pacific (excluding high income)East Asia & Pacific (IDA & IBRD countries)EcuadorEgypt, Arab Rep.El SalvadorEquatorial GuineaEritreaEstoniaEthiopiaEuro areaEurope & Central AsiaEurope & Central Asia (excluding high income)Europe & Central Asia (IDA & IBRD countries)European UnionFaroe IslandsFijiFinlandFragile and conflict affected situationsFranceFrench PolynesiaGabonGambia, TheGeorgiaGermanyGhanaGibraltarGreeceGreenlandGrenadaGuamGuatemalaGuineaGuinea-BissauGuyanaHaitiHeavily indebted poor countries (HIPC)High incomeHondurasHong Kong SAR, ChinaHungaryIBRD onlyIcelandIDA & IBRD totalIDA blendIDA onlyIDA totalIndiaIndonesiaIran, Islamic Rep.IraqIrelandIsraelItalyJamaicaJapanJordanKazakhstanKenyaKiribatiKorea, Dem. People’s Rep.Korea, Rep.KosovoKuwaitKyrgyz RepublicLao PDRLate-demographic dividendLatin America & Caribbean Latin America & Caribbean (excluding high income)Latin America & the Caribbean (IDA & IBRD countries)LatviaLeast developed countries: UN classificationLebanonLesothoLiberiaLibyaLiechtensteinLithuaniaLow & middle incomeLow incomeLower middle incomeLuxembourgMacao SAR, ChinaMacedonia, FYRMadagascarMalawiMalaysiaMaldivesMaliMaltaMarshall IslandsMauritaniaMauritiusMexicoMicronesia, Fed. Sts.Middle East & North AfricaMiddle East & North Africa (excluding high income)Middle East & North Africa (IDA & IBRD countries)Middle incomeMoldovaMonacoMongoliaMontenegroMoroccoMozambiqueMyanmarNamibiaNauruNepalNetherlandsNew CaledoniaNew ZealandNicaraguaNigerNigeriaNorth AmericaNorthern Mariana IslandsNorwayOECD membersOmanOther small statesPacific island small statesPakistanPalauPanamaPapua New GuineaParaguayPeruPhilippinesPolandPortugalPost-demographic dividendPre-demographic dividendPuerto RicoQatarRomaniaRussian FederationRwandaSamoaSan MarinoSao Tome and PrincipeSaudi ArabiaSenegalSerbiaSeychellesSierra LeoneSingaporeSlovak RepublicSloveniaSmall statesSolomon IslandsSomaliaSouth AfricaSouth AsiaSouth Asia (IDA & IBRD)South SudanSpainSri LankaSt. Kitts and NevisSt. LuciaSt. Vincent and the GrenadinesSub-Saharan Africa Sub-Saharan Africa (excluding high income)Sub-Saharan Africa (IDA & IBRD countries)SudanSurinameSwazilandSwedenSwitzerlandSyrian Arab RepublicTajikistanTanzaniaThailandTimor-LesteTogoTongaTrinidad and TobagoTunisiaTurkeyTurkmenistanTurks and Caicos IslandsTuvaluUgandaUkraineUnited Arab EmiratesUnited KingdomUnited StatesUpper middle incomeUruguayUzbekistanVanuatuVenezuela, RBVietnamVirgin Islands (U.S.)West Bank and GazaWorldYemen, Rep.ZambiaZimbabwe Timeline:
This timeline shows a graph from 1966 to 2016 of Ecuador. No data until 1965. Number of actual observations by date: 43.
Source name:
World Development Indicators
Source organization:
International Telecommunication Union, World Telecommunication/ICT Development Report and database.
Categories, topics:
Infrastructure
Last updated:
apr 23, 2017
Indicators value changes by year
Maximum:
15.486
jan 1, 2016
At the date of observation
Value
Absolute change
Change from previous value
jan 1, 1966
0.921
+0.921
0.0%
jan 1, 1971
1.494
+0.573
62.23%
jan 1, 1976
2.381
+0.888
59.42%
jan 1, 1977
2.472
+0.091
3.81%
jan 1, 1978
2.53
+0.058
2.33%
jan 1, 1979
2.664
+0.134
5.28%
jan 1, 1980
2.815
+0.152
5.7%
jan 1, 1981
2.87
+0.055
1.94%
jan 1, 1982
2.979
+0.109
3.8%
jan 1, 1983
3.122
+0.143
4.79%
jan 1, 1984
3.106
-0.016
-0.51%
jan 1, 1985
3.021
-0.085
-2.75%
jan 1, 1986
2.996
-0.024
-0.8%
jan 1, 1987
3.118
+0.121
4.04%
jan 1, 1988
3.562
+0.445
14.26%
jan 1, 1989
3.975
+0.413
11.58%
jan 1, 1990
4.594
+0.619
15.57%
jan 1, 1991
4.845
+0.252
5.48%
jan 1, 1992
4.743
-0.102
-2.11%
jan 1, 1993
5.014
+0.271
5.71%
jan 1, 1994
5.521
+0.508
10.12%
jan 1, 1995
5.942
+0.421
7.62%
jan 1, 1996
6.168
+0.226
3.8%
jan 1, 1997
6.929
+0.761
12.34%
jan 1, 1998
7.631
+0.702
10.13%
jan 1, 1999
8.228
+0.597
7.82%
jan 1, 2000
9.193
+0.965
11.73%
jan 1, 2001
9.77
+0.577
6.27%
jan 1, 2002
10.451
+0.682
6.98%
jan 1, 2003
10.829
+0.378
3.62%
jan 1, 2004
11.527
+0.697
6.44%
jan 1, 2005
11.758
+0.232
2.01%
jan 1, 2006
12.191
+0.433
3.68%
jan 1, 2007
12.659
+0.468
3.84%
jan 1, 2008
12.777
+0.118
0.93%
jan 1, 2009
13.137
+0.36
2.81%
jan 1, 2010
13.643
+0.506
3.85%
jan 1, 2011
13.903
+0.26
1.91%
jan 1, 2012
14.499
+0.596
4.28%
jan 1, 2013
14.902
+0.403
2.78%
jan 1, 2014
15.217
+0.315
2.11%
jan 1, 2015
15.277
+0.061
0.4%
jan 1, 2016
15.486
+0.208
1.36%
Ranking of countries by current statistics by years


Comments: