29
/
en
AIzaSyAYiBZKx7MnpbEhh9jyipgxe19OcubqV5w
April 1, 2024
79258
Barbados
BRB
true
2
1
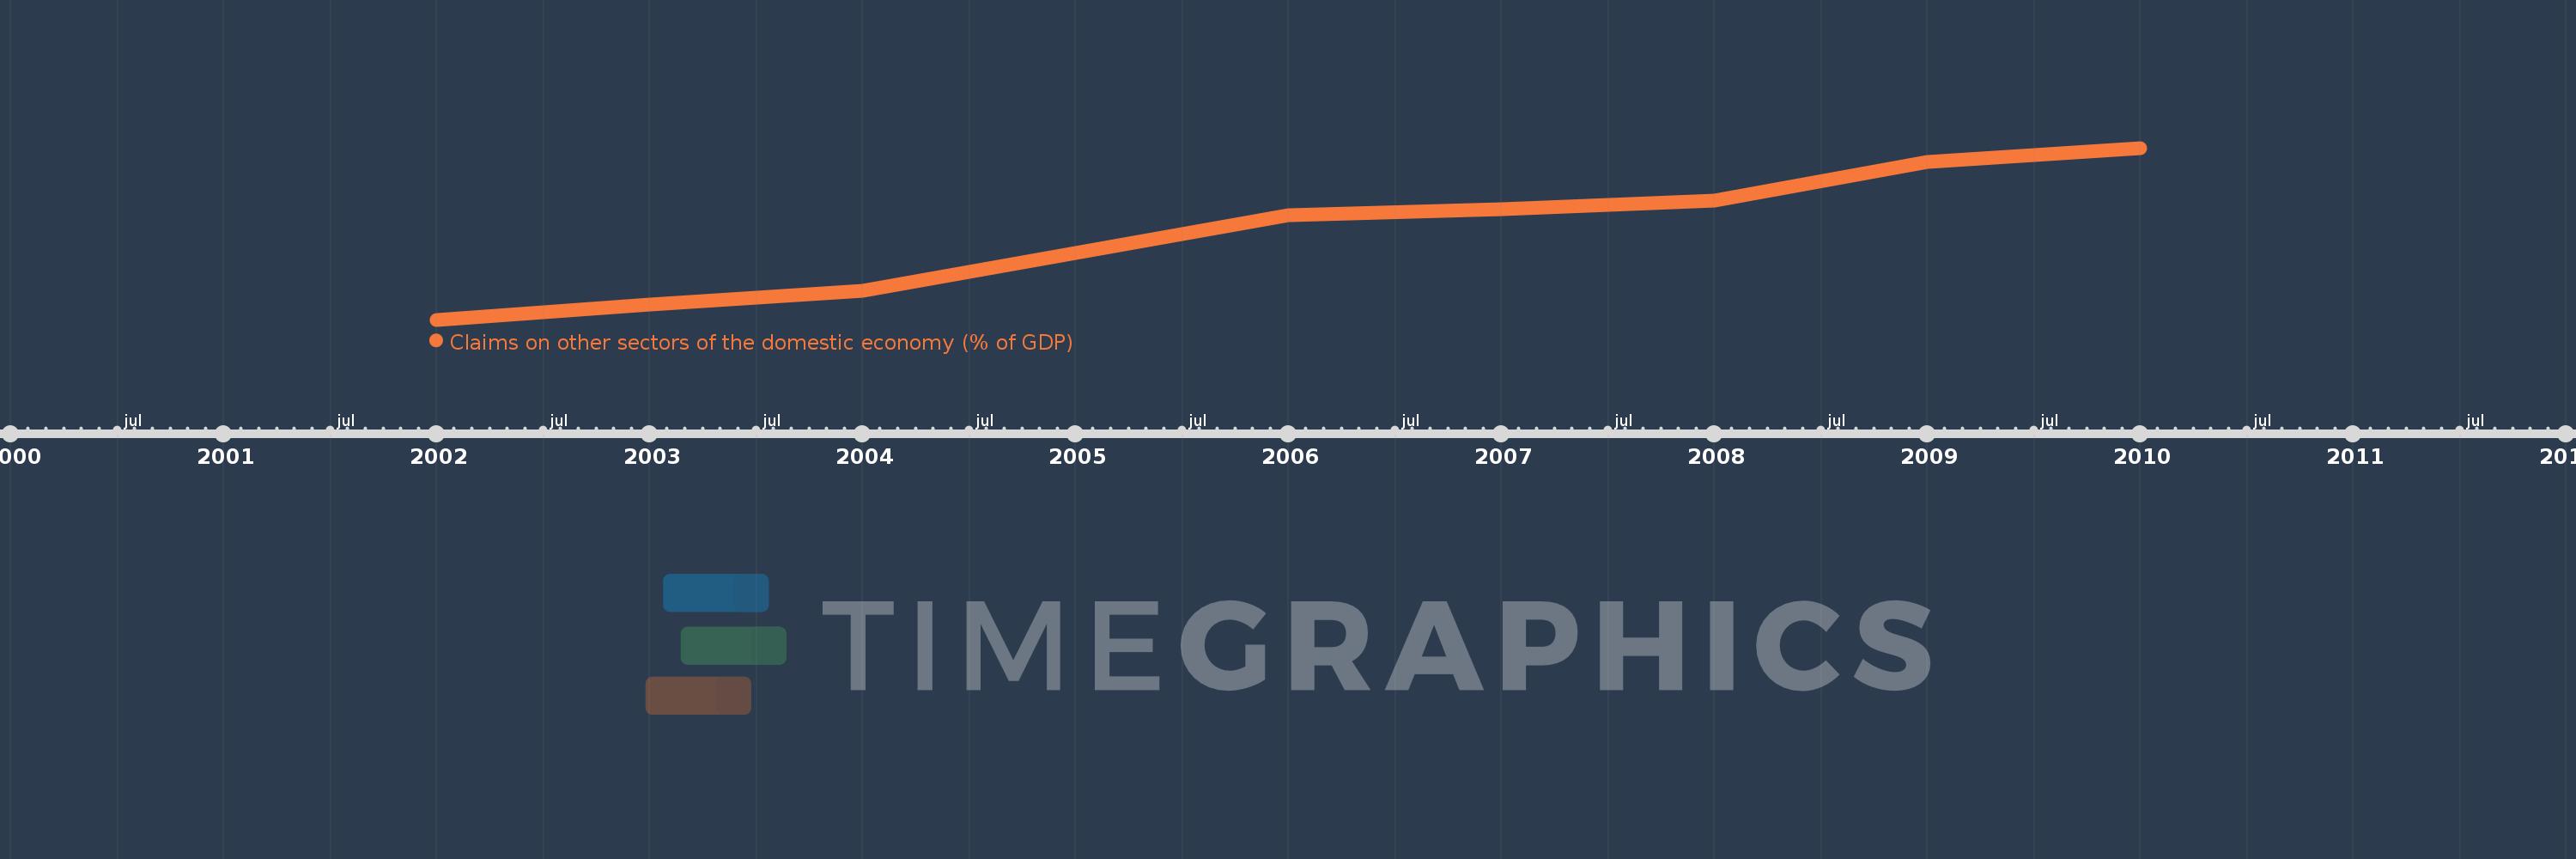
Claims on other sectors of the domestic economy (% of GDP)
2010,2009,2008,2007,2006,2005,2004,2003,2002
This statistics in other country:
Timeline:
This timeline shows a graph from 2002 to 2010 of Barbados. No data until 2001. Number of actual observations by date: 9.
Source name:
World Development Indicators
Source organization:
International Monetary Fund, International Financial Statistics and data files, and World Bank and OECD GDP estimates.
Categories, topics:
Financial Sector
Last updated:
apr 23, 2017
Indicators value changes by year
Minimum:
62.204
jan 1, 2002
Maximum:
91.599
jan 1, 2010
At the date of observation
Value
Absolute change
Change from previous value
jan 1, 2002
62.204
+62.204
0.0%
jan 1, 2003
64.846
+2.642
4.25%
jan 1, 2004
67.157
+2.311
3.56%
jan 1, 2005
73.653
+6.495
9.67%
jan 1, 2006
80.109
+6.456
8.77%
jan 1, 2007
81.181
+1.072
1.34%
jan 1, 2008
82.54
+1.36
1.68%
jan 1, 2009
89.144
+6.604
8.0%
jan 1, 2010
91.599
+2.455
2.75%
Ranking of countries by current statistics by years


Comments: