29
/
en
AIzaSyAYiBZKx7MnpbEhh9jyipgxe19OcubqV5w
April 1, 2024
169700
Korea, Rep.
KOR
true
2
1
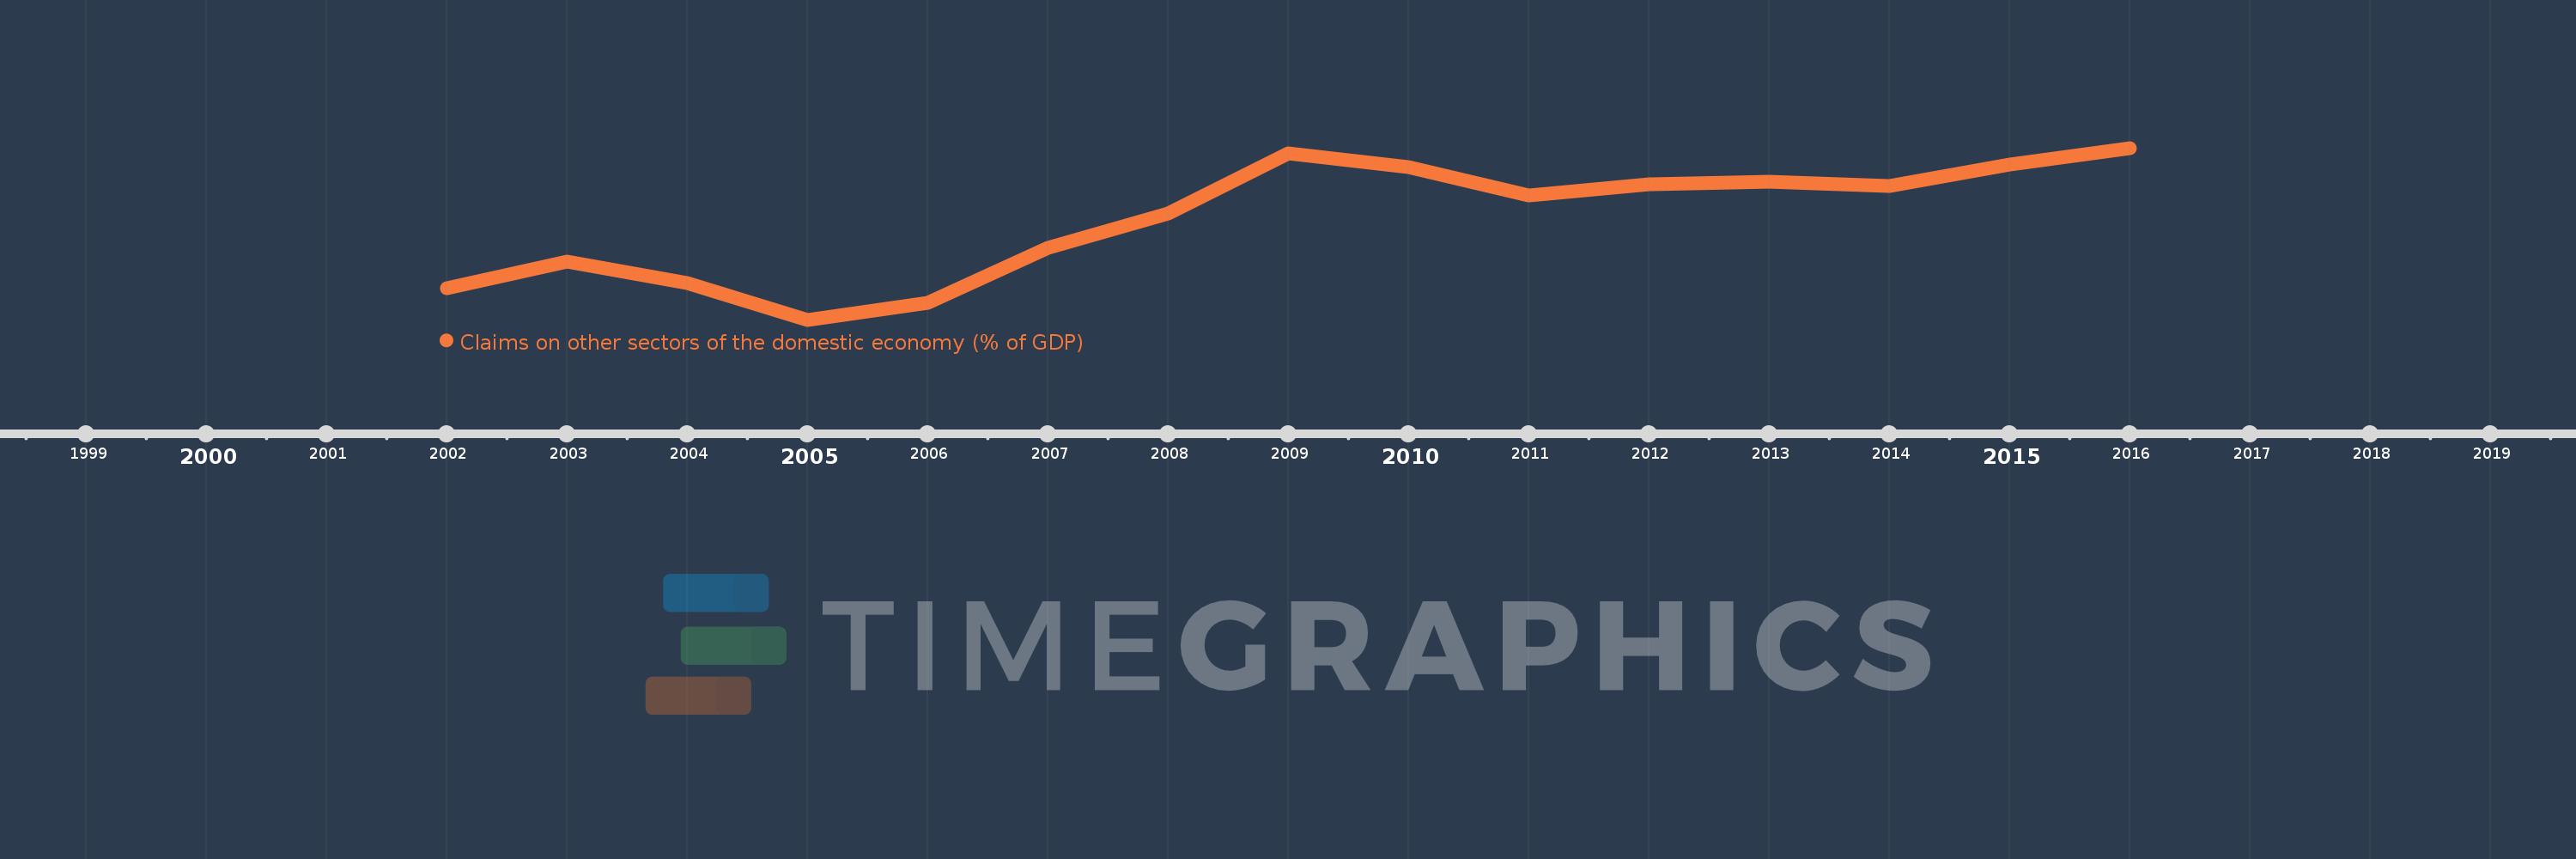
Claims on other sectors of the domestic economy (% of GDP)
2016,2015,2014,2013,2012,2011,2010,2009,2008,2007,2006,2005,2004,2003,2002
This statistics in other country:
Timeline:
This timeline shows a graph from 2002 to 2016 of Korea, Rep.. No data until 2001. Number of actual observations by date: 15.
Source name:
World Development Indicators
Source organization:
International Monetary Fund, International Financial Statistics and data files, and World Bank and OECD GDP estimates.
Categories, topics:
Financial Sector
Last updated:
apr 23, 2017
Indicators value changes by year
Minimum:
123.895
jan 1, 2005
Maximum:
167.046
jan 1, 2016
At the date of observation
Value
Absolute change
Change from previous value
jan 1, 2002
131.871
+131.871
0.0%
jan 1, 2003
138.519
+6.648
5.04%
jan 1, 2004
133.049
-5.471
-3.95%
jan 1, 2005
123.895
-9.154
-6.88%
jan 1, 2006
128.224
+4.329
3.49%
jan 1, 2007
141.941
+13.717
10.7%
jan 1, 2008
150.6
+8.659
6.1%
jan 1, 2009
165.627
+15.027
9.98%
jan 1, 2010
162.308
-3.319
-2.0%
jan 1, 2011
155.089
-7.219
-4.45%
jan 1, 2012
157.839
+2.751
1.77%
jan 1, 2013
158.536
+0.697
0.44%
jan 1, 2014
157.43
-1.106
-0.7%
jan 1, 2015
162.822
+5.391
3.42%
jan 1, 2016
167.046
+4.224
2.59%
Ranking of countries by current statistics by years


Comments: