29
/
en
AIzaSyAYiBZKx7MnpbEhh9jyipgxe19OcubqV5w
April 1, 2024
142777
Grenada
GRD
true
2
1
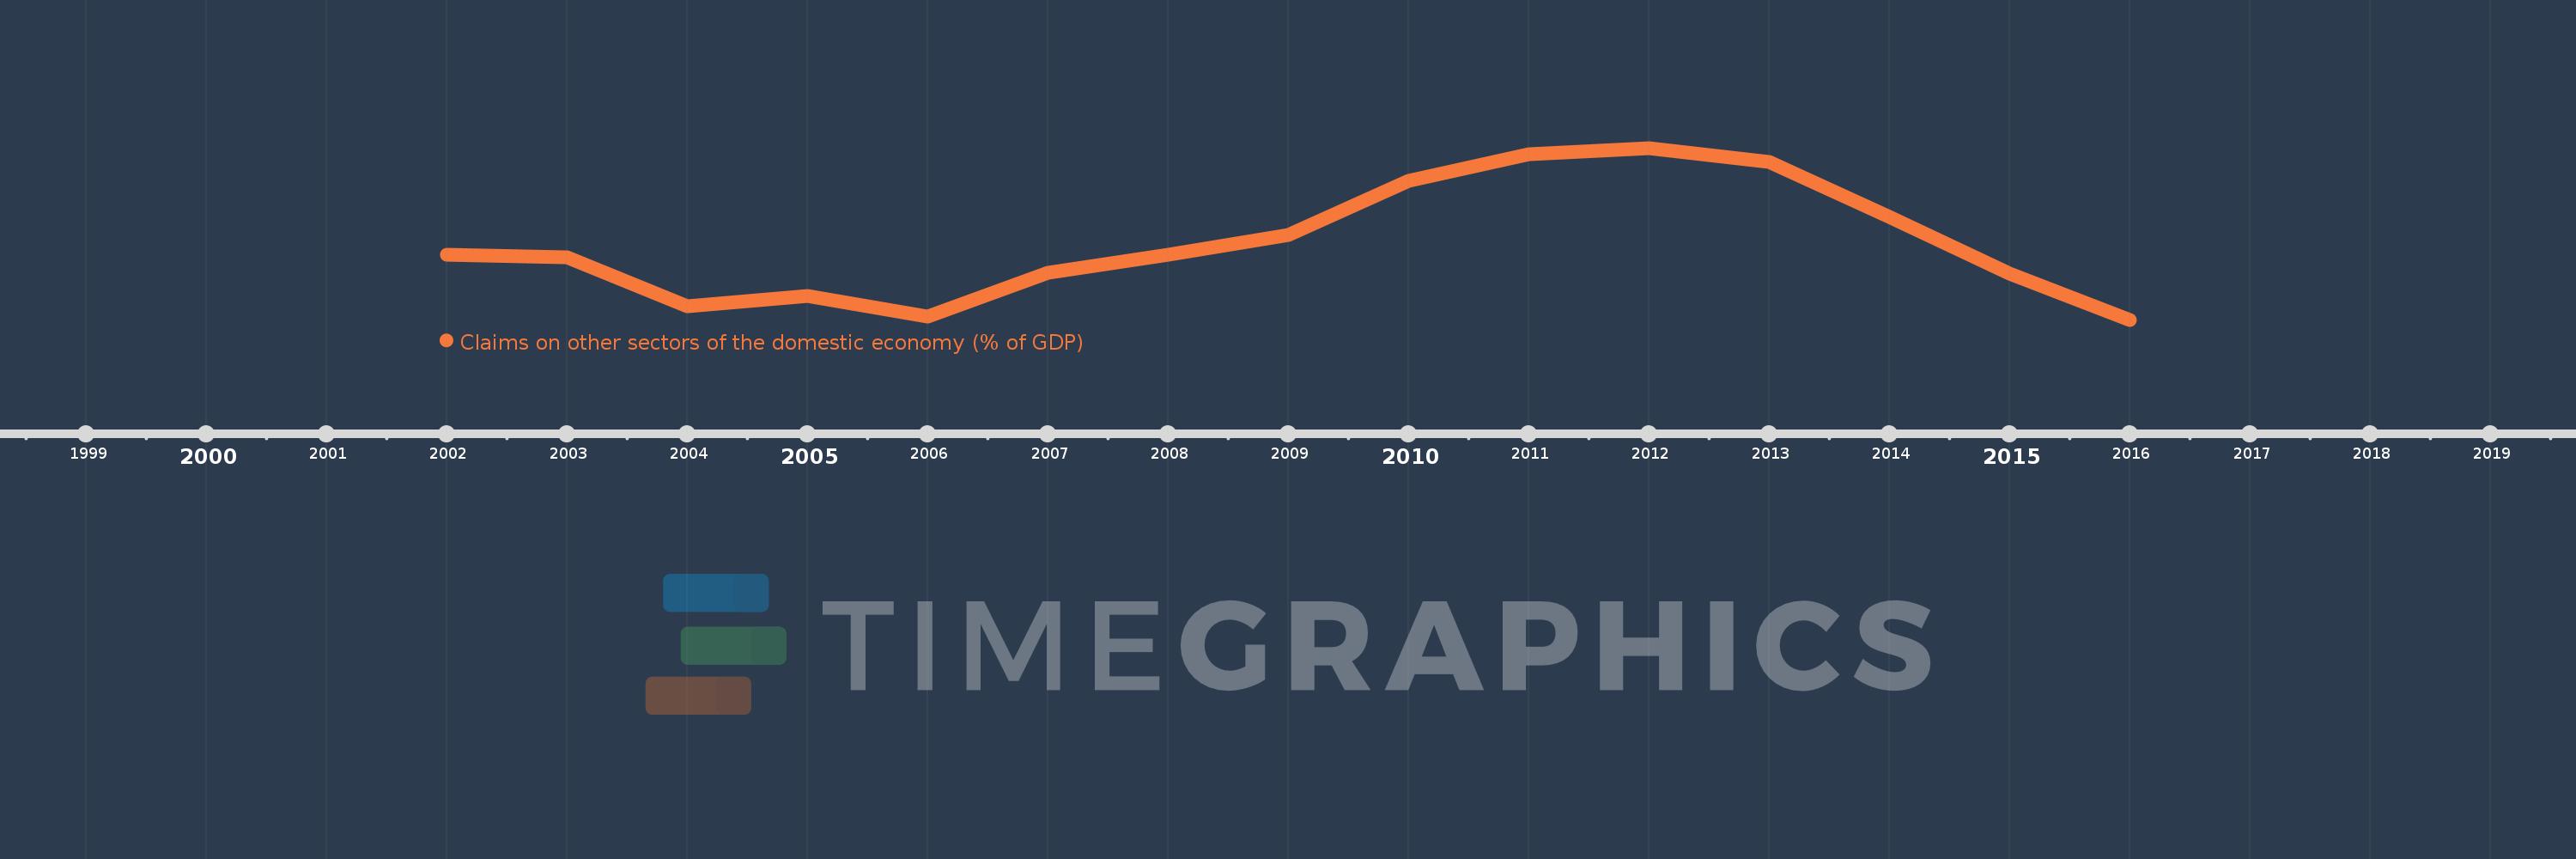
Claims on other sectors of the domestic economy (% of GDP)
2016,2015,2014,2013,2012,2011,2010,2009,2008,2007,2006,2005,2004,2003,2002
This statistics in other country:
Timeline:
This timeline shows a graph from 2002 to 2016 of Grenada. No data until 2001. Number of actual observations by date: 15.
Source name:
World Development Indicators
Source organization:
International Monetary Fund, International Financial Statistics and data files, and World Bank and OECD GDP estimates.
Categories, topics:
Financial Sector
Last updated:
apr 23, 2017
Indicators value changes by year
Minimum:
60.136
jan 1, 2016
Maximum:
88.507
jan 1, 2012
At the date of observation
Value
Absolute change
Change from previous value
jan 1, 2002
70.811
+70.811
0.0%
jan 1, 2003
70.458
-0.353
-0.5%
jan 1, 2004
62.306
-8.153
-11.57%
jan 1, 2005
64.102
+1.796
2.88%
jan 1, 2006
60.638
-3.464
-5.4%
jan 1, 2007
67.877
+7.239
11.94%
jan 1, 2008
70.85
+2.973
4.38%
jan 1, 2009
74.151
+3.301
4.66%
jan 1, 2010
83.092
+8.941
12.06%
jan 1, 2011
87.542
+4.449
5.35%
jan 1, 2012
88.507
+0.965
1.1%
jan 1, 2013
86.224
-2.283
-2.58%
jan 1, 2014
77.067
-9.157
-10.62%
jan 1, 2015
67.718
-9.35
-12.13%
jan 1, 2016
60.136
-7.582
-11.2%
Ranking of countries by current statistics by years


Comments: