29
/
en
AIzaSyAYiBZKx7MnpbEhh9jyipgxe19OcubqV5w
April 1, 2024
235477
Senegal
SEN
true
2
1
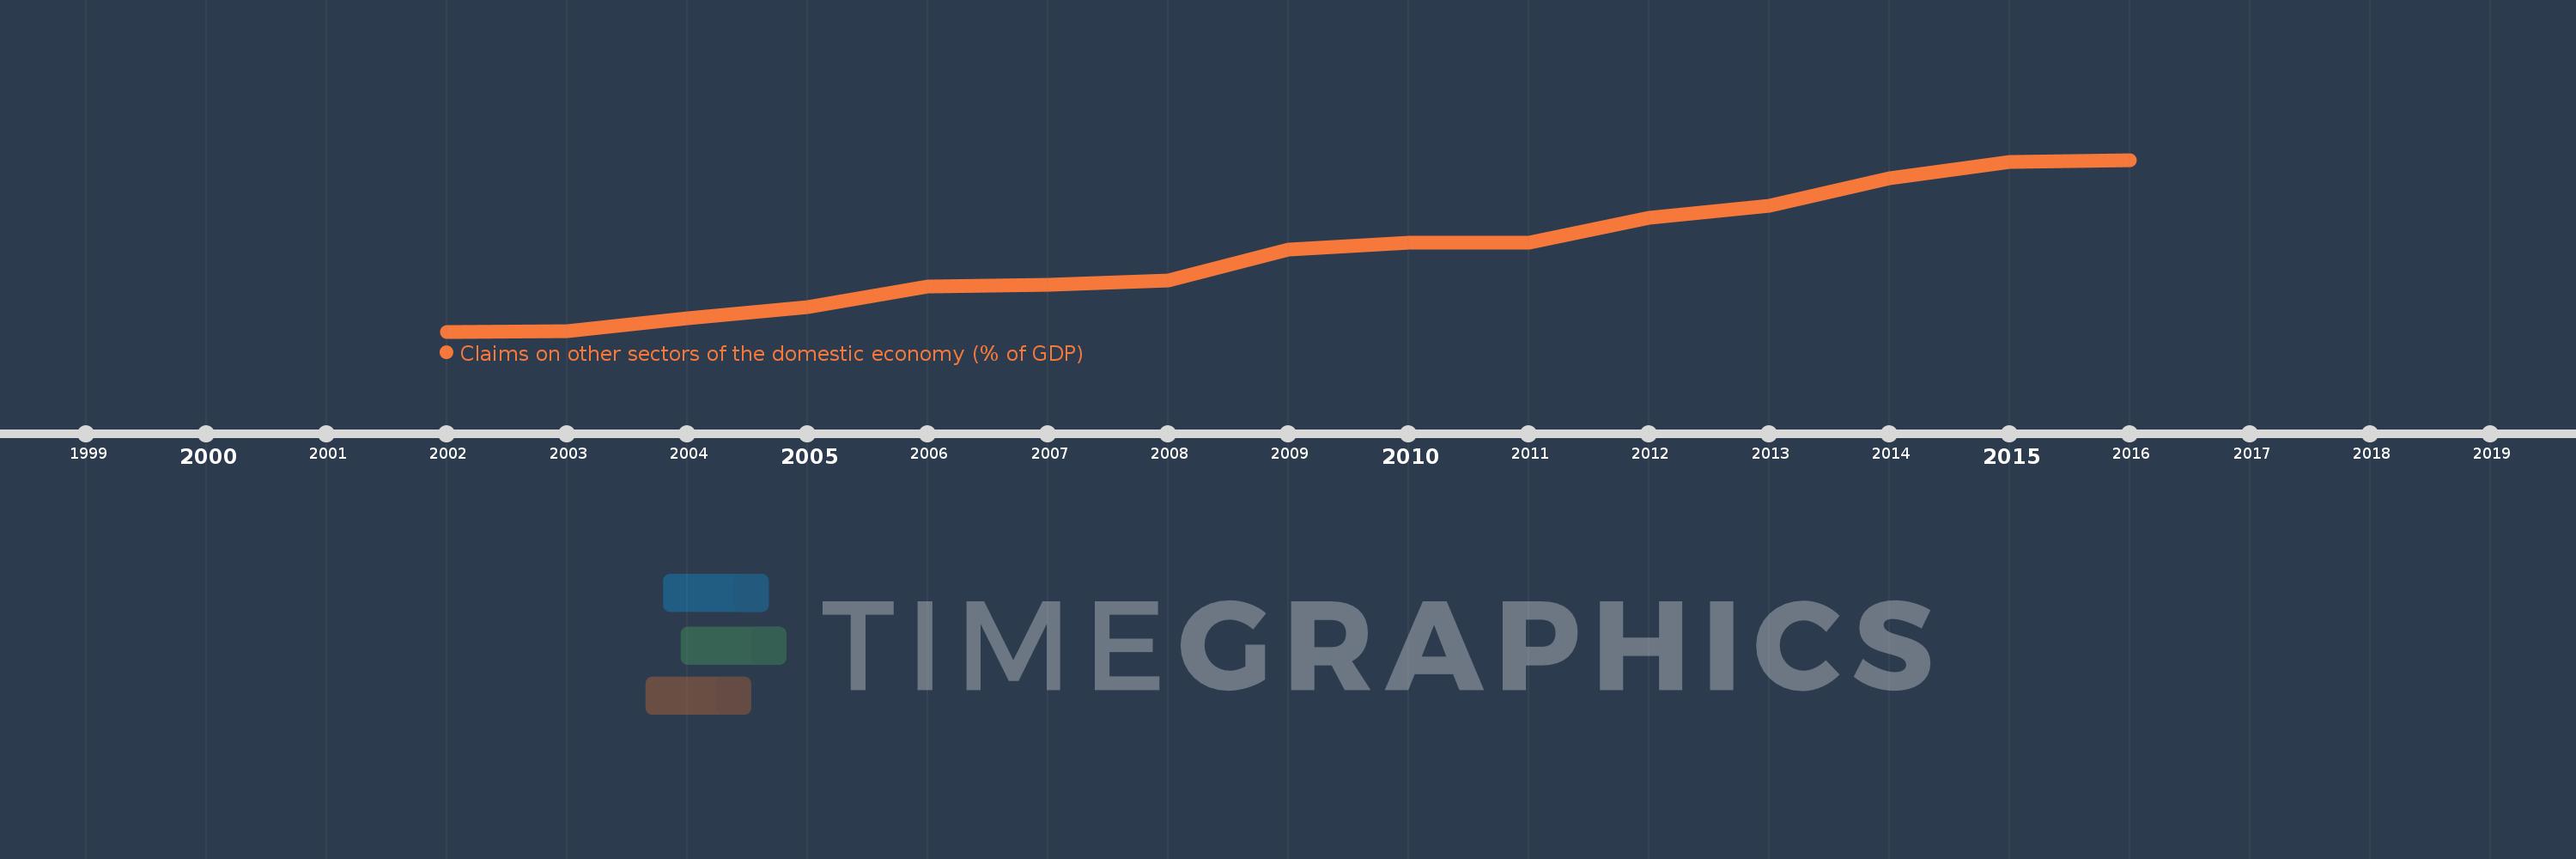
Claims on other sectors of the domestic economy (% of GDP)
2016,2015,2014,2013,2012,2011,2010,2009,2008,2007,2006,2005,2004,2003,2002
This statistics in other country:
Timeline:
This timeline shows a graph from 2002 to 2016 of Senegal. No data until 2001. Number of actual observations by date: 15.
Source name:
World Development Indicators
Source organization:
International Monetary Fund, International Financial Statistics and data files, and World Bank and OECD GDP estimates.
Categories, topics:
Financial Sector
Last updated:
apr 23, 2017
Indicators value changes by year
Minimum:
16.021
jan 1, 2002
At the date of observation
Value
Absolute change
Change from previous value
jan 1, 2002
16.021
+16.021
0.0%
jan 1, 2003
16.109
+0.088
0.55%
jan 1, 2004
17.601
+1.492
9.26%
jan 1, 2005
19.022
+1.421
8.07%
jan 1, 2006
21.571
+2.549
13.4%
jan 1, 2007
21.739
+0.168
0.78%
jan 1, 2008
22.273
+0.533
2.45%
jan 1, 2009
26.047
+3.774
16.94%
jan 1, 2010
26.886
+0.839
3.22%
jan 1, 2011
26.906
+0.02
0.07%
jan 1, 2012
29.909
+3.003
11.16%
jan 1, 2013
31.351
+1.442
4.82%
jan 1, 2014
34.786
+3.435
10.96%
jan 1, 2015
36.7
+1.914
5.5%
jan 1, 2016
37.01
+0.31
0.84%
Ranking of countries by current statistics by years


Comments: