29
/
en
AIzaSyAYiBZKx7MnpbEhh9jyipgxe19OcubqV5w
April 1, 2024
42162
Latin America & Caribbean (excluding high income)
LAC
false
2
1
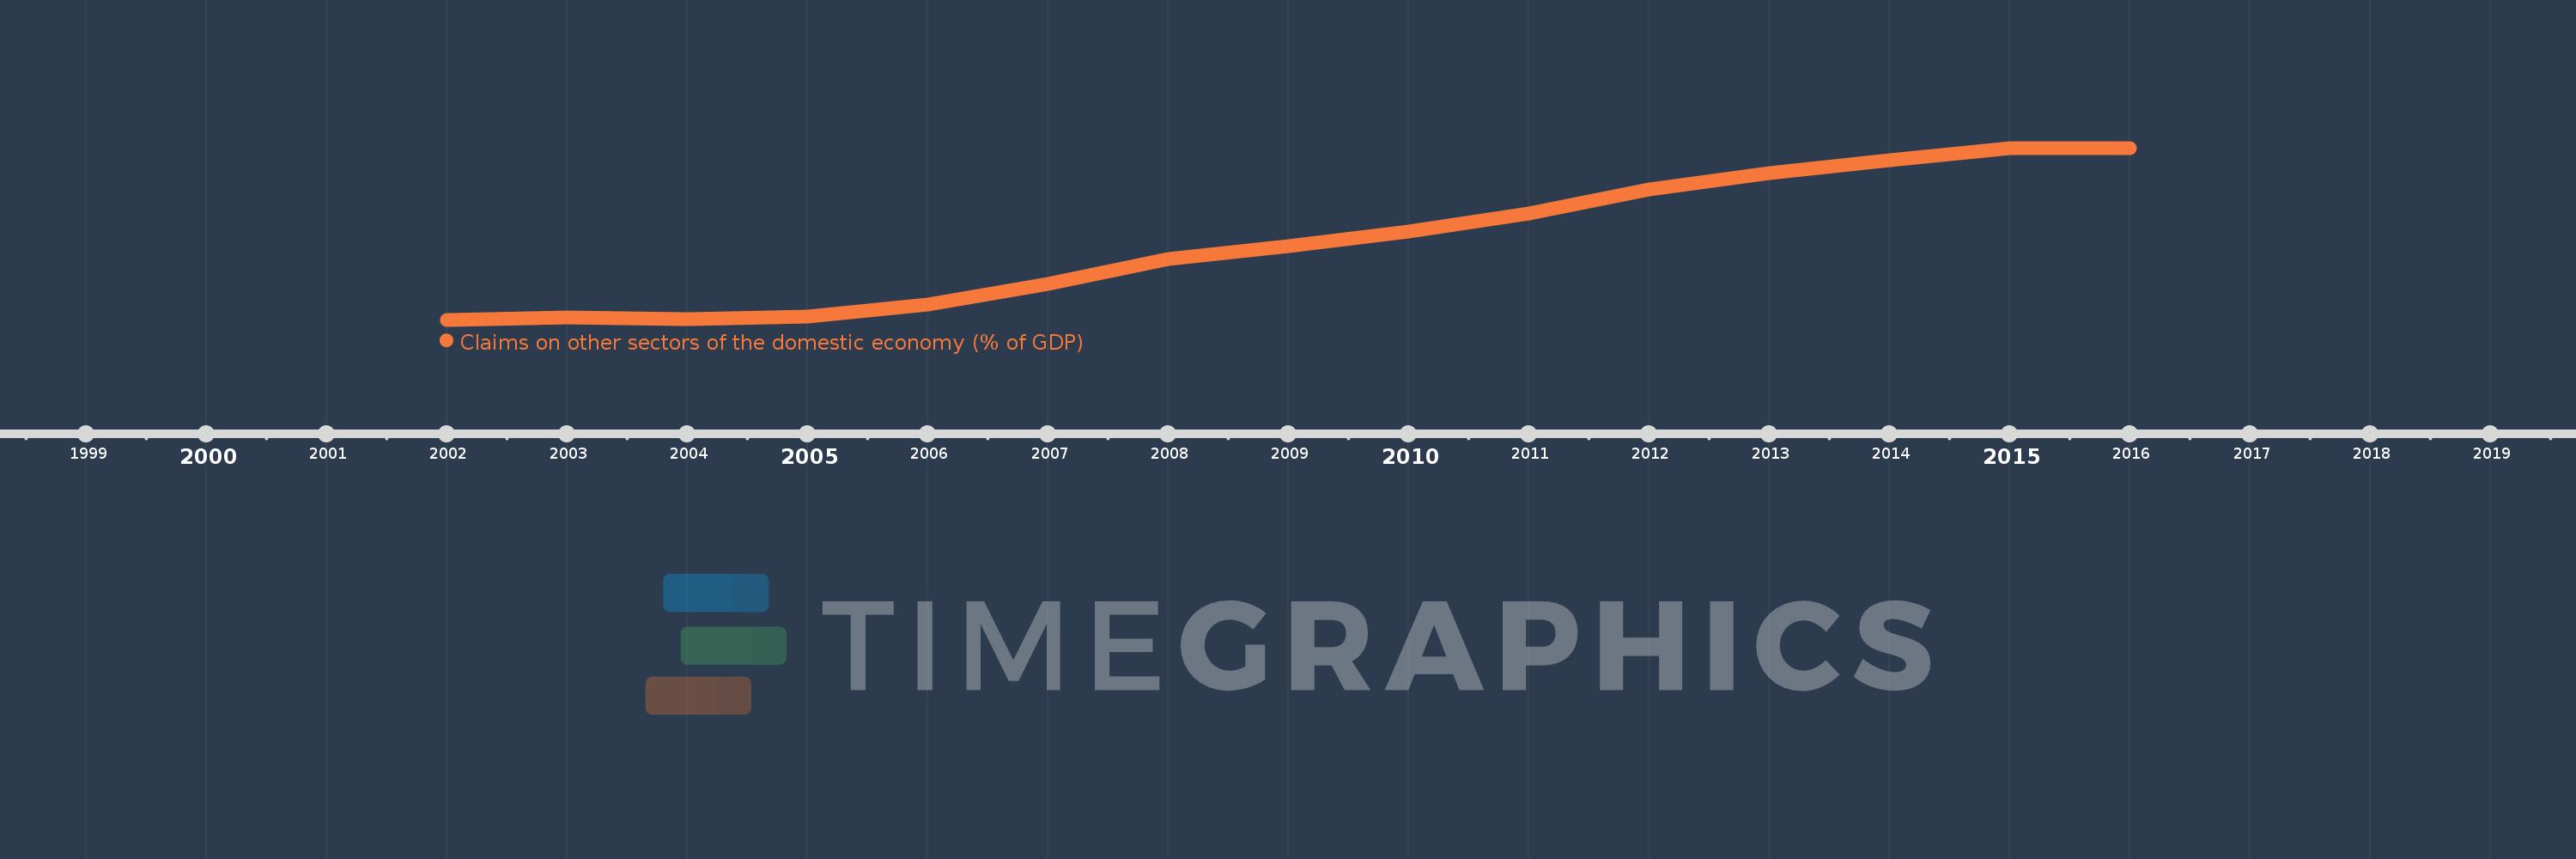
Claims on other sectors of the domestic economy (% of GDP)
2016,2015,2014,2013,2012,2011,2010,2009,2008,2007,2006,2005,2004,2003,2002
This statistics in other country:
Timeline:
This timeline shows a graph from 2002 to 2016 of Latin America & Caribbean (excluding high income). No data until 2001. Number of actual observations by date: 15.
Source name:
World Development Indicators
Source organization:
International Monetary Fund, International Financial Statistics and data files, and World Bank and OECD GDP estimates.
Categories, topics:
Financial Sector
Last updated:
apr 23, 2017
Indicators value changes by year
Minimum:
23.646
jan 1, 2002
Maximum:
60.688
jan 1, 2015
At the date of observation
Value
Absolute change
Change from previous value
jan 1, 2002
23.646
+23.646
0.0%
jan 1, 2003
24.074
+0.428
1.81%
jan 1, 2004
23.851
-0.223
-0.93%
jan 1, 2005
24.389
+0.539
2.26%
jan 1, 2006
27.016
+2.626
10.77%
jan 1, 2007
31.378
+4.362
16.15%
jan 1, 2008
36.765
+5.388
17.17%
jan 1, 2009
39.576
+2.811
7.65%
jan 1, 2010
42.592
+3.016
7.62%
jan 1, 2011
46.61
+4.018
9.43%
jan 1, 2012
51.725
+5.115
10.97%
jan 1, 2013
55.218
+3.493
6.75%
jan 1, 2014
57.962
+2.743
4.97%
jan 1, 2015
60.688
+2.726
4.7%
jan 1, 2016
60.667
-0.021
-0.03%
Ranking of countries by current statistics by years


Comments: