29
/
en
AIzaSyAYiBZKx7MnpbEhh9jyipgxe19OcubqV5w
April 1, 2024
80285
Belarus
BLR
true
2
1
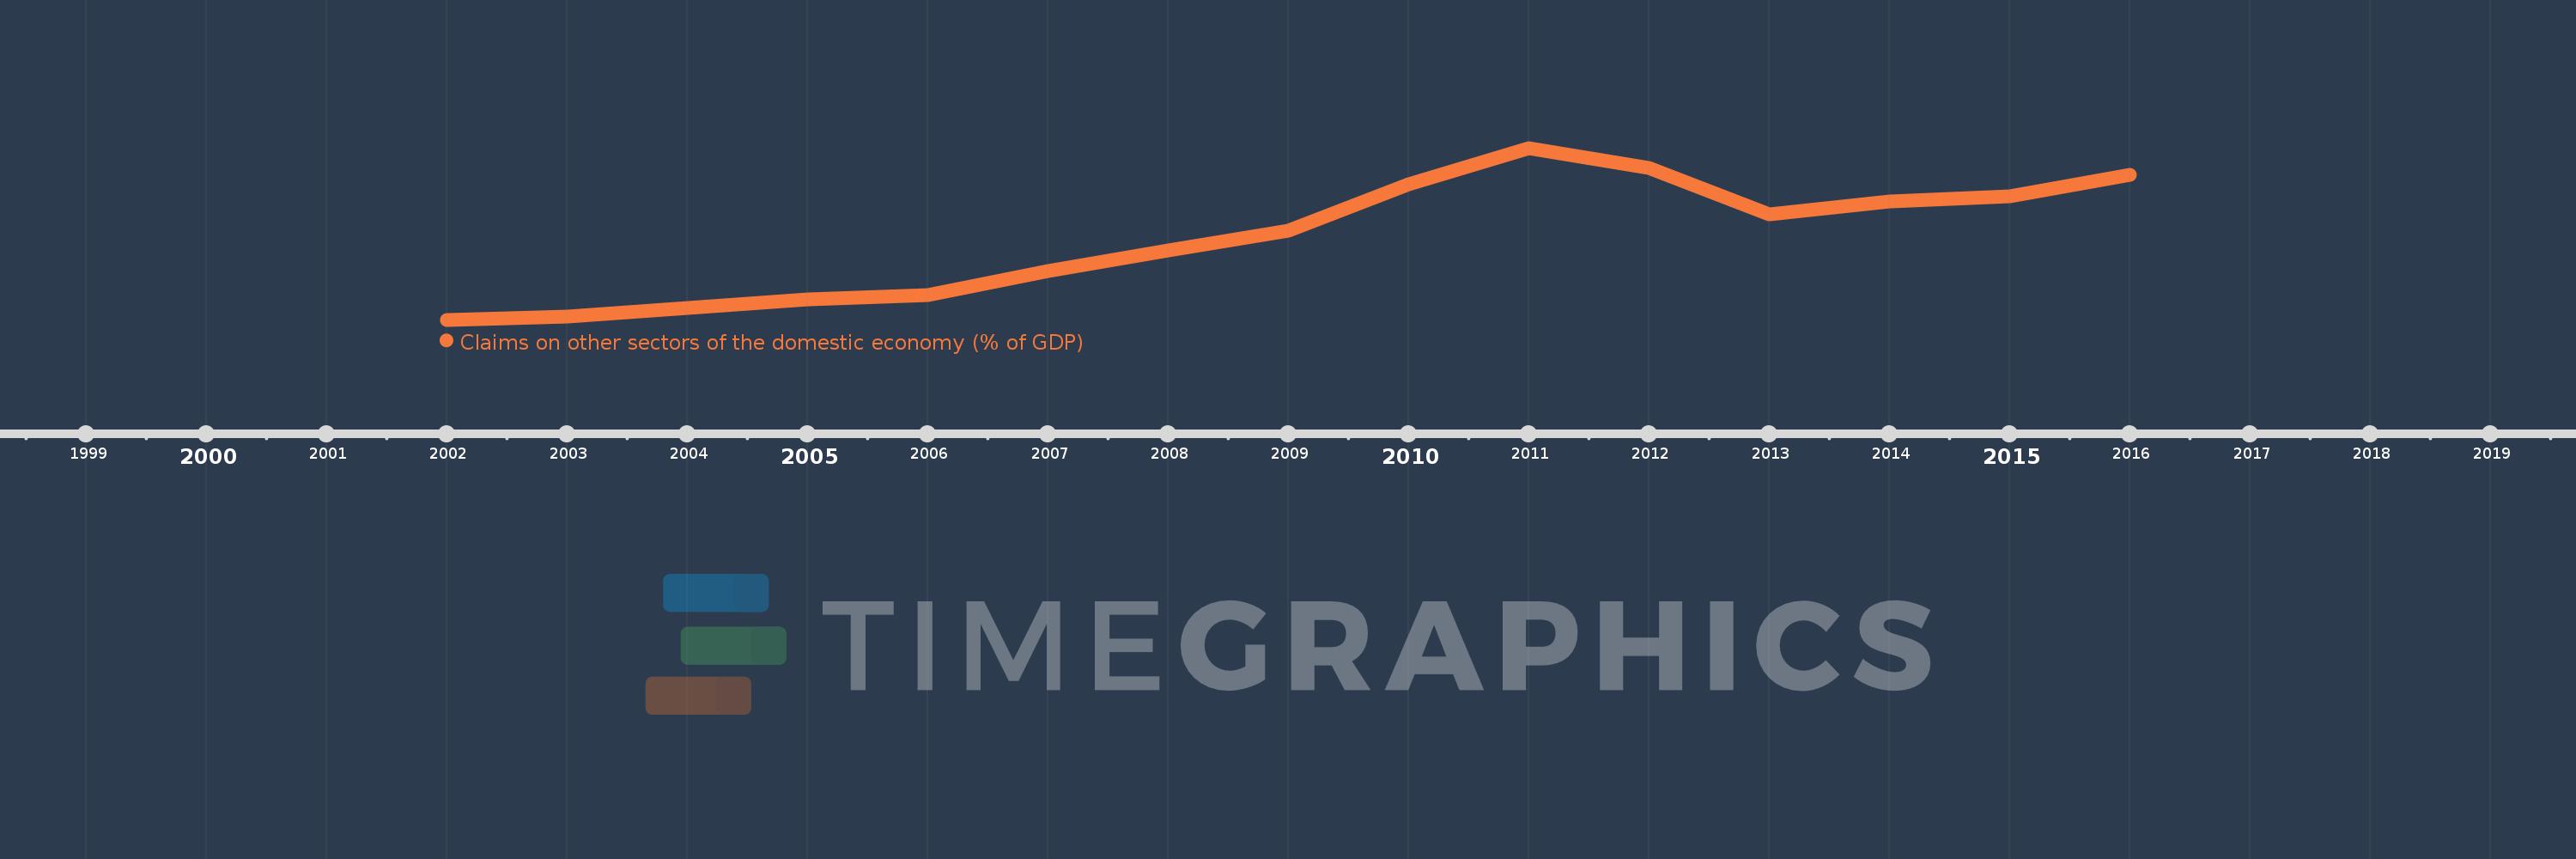
Claims on other sectors of the domestic economy (% of GDP)
2016,2015,2014,2013,2012,2011,2010,2009,2008,2007,2006,2005,2004,2003,2002
This statistics in other country:
Timeline:
This timeline shows a graph from 2002 to 2016 of Belarus. No data until 2001. Number of actual observations by date: 15.
Source name:
World Development Indicators
Source organization:
International Monetary Fund, International Financial Statistics and data files, and World Bank and OECD GDP estimates.
Categories, topics:
Financial Sector
Last updated:
apr 23, 2017
Indicators value changes by year
At the date of observation
Value
Absolute change
Change from previous value
jan 1, 2002
1.491
+1.491
0.0%
jan 1, 2003
1.566
+0.075
5.06%
jan 1, 2004
1.797
+0.231
14.78%
jan 1, 2005
2.028
+0.231
12.83%
jan 1, 2006
2.133
+0.105
5.19%
jan 1, 2007
2.78
+0.647
30.32%
jan 1, 2008
3.319
+0.538
19.37%
jan 1, 2009
3.824
+0.505
15.22%
jan 1, 2010
5.052
+1.228
32.12%
jan 1, 2011
6.004
+0.951
18.83%
jan 1, 2012
5.468
-0.536
-8.92%
jan 1, 2013
4.267
-1.2
-21.95%
jan 1, 2014
4.603
+0.336
7.87%
jan 1, 2015
4.734
+0.131
2.84%
jan 1, 2016
5.295
+0.56
11.83%
Ranking of countries by current statistics by years


Comments: