29
/
en
AIzaSyAYiBZKx7MnpbEhh9jyipgxe19OcubqV5w
April 1, 2024
254971
Swaziland
SWZ
true
2
1
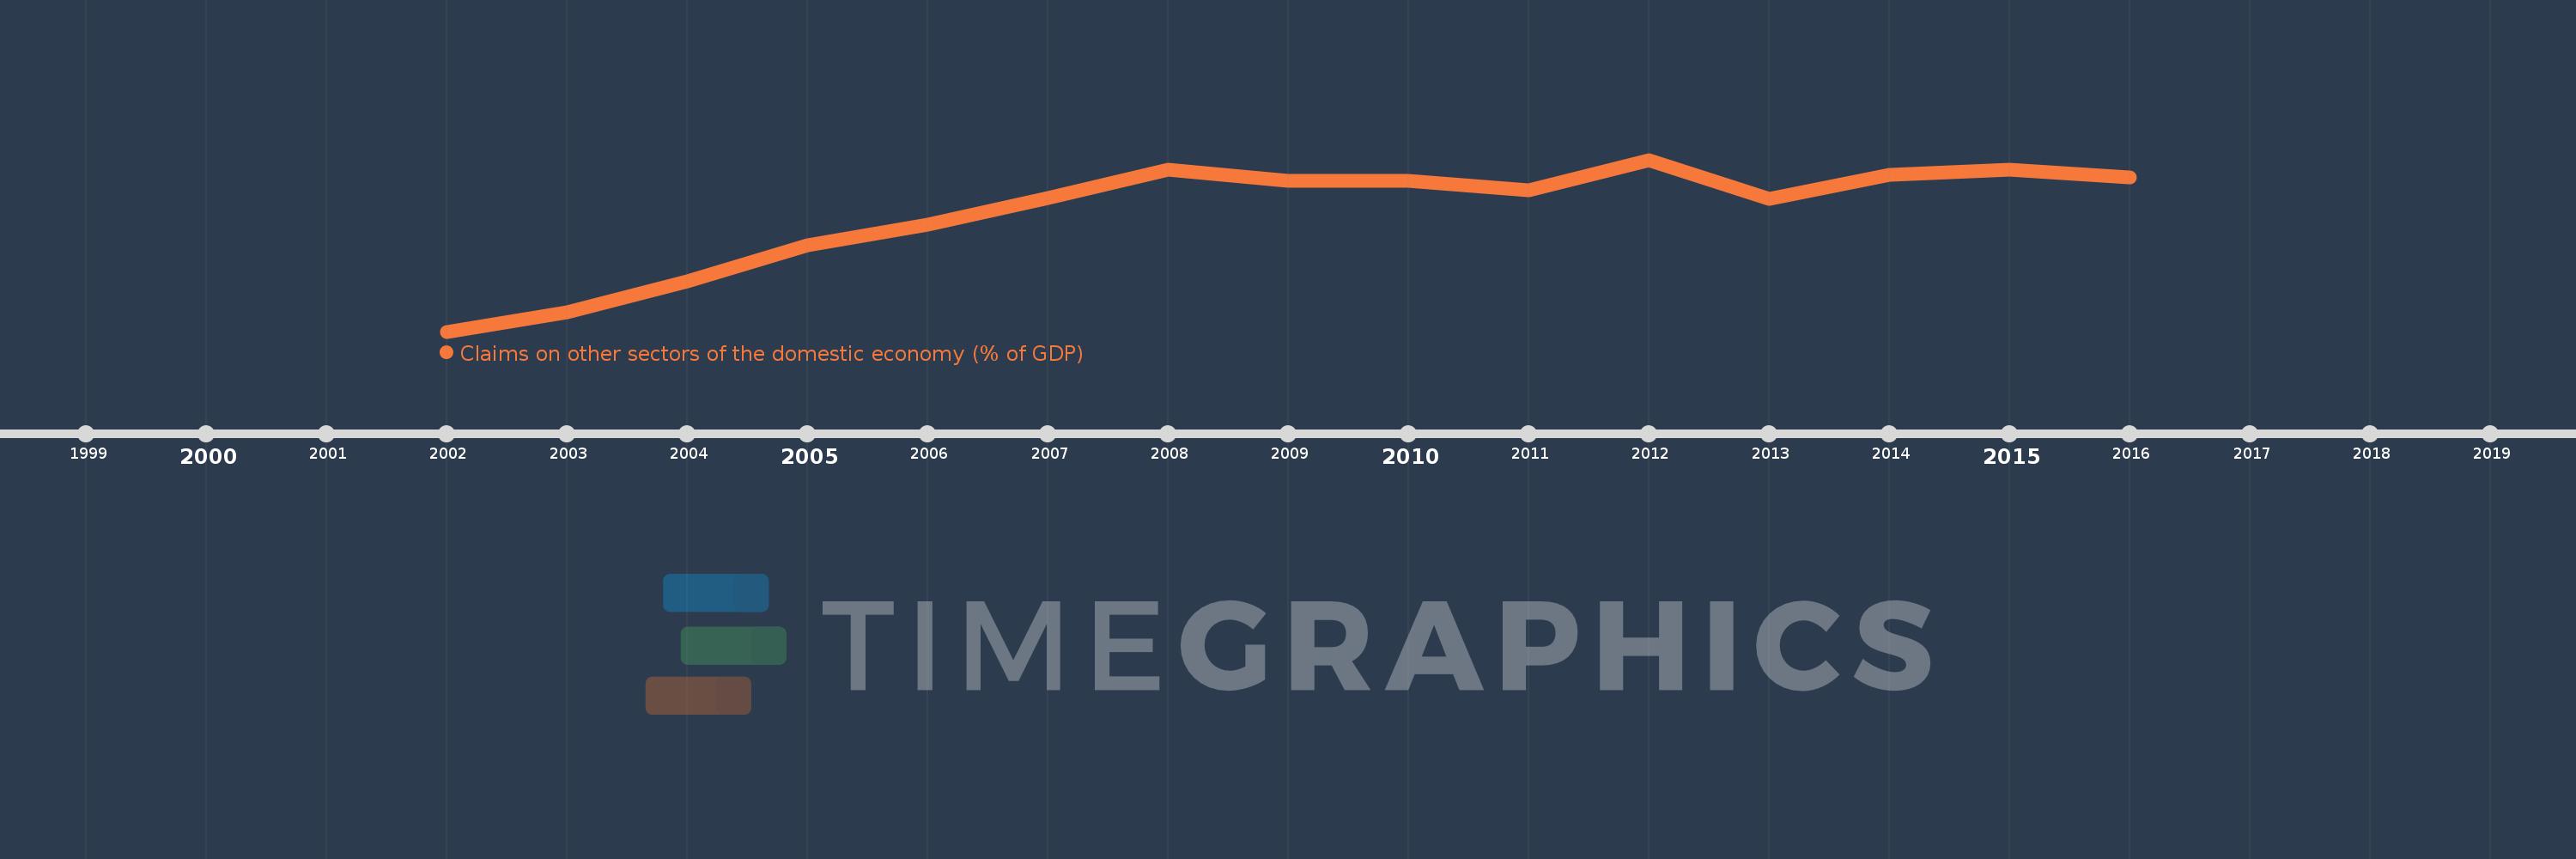
Claims on other sectors of the domestic economy (% of GDP)
2016,2015,2014,2013,2012,2011,2010,2009,2008,2007,2006,2005,2004,2003,2002
This statistics in other country:
Timeline:
This timeline shows a graph from 2002 to 2016 of Swaziland. No data until 2001. Number of actual observations by date: 15.
Source name:
World Development Indicators
Source organization:
International Monetary Fund, International Financial Statistics and data files, and World Bank and OECD GDP estimates.
Categories, topics:
Financial Sector
Last updated:
apr 23, 2017
Indicators value changes by year
Minimum:
10.658
jan 1, 2002
Maximum:
22.988
jan 1, 2012
At the date of observation
Value
Absolute change
Change from previous value
jan 1, 2002
10.658
+10.658
0.0%
jan 1, 2003
12.026
+1.368
12.83%
jan 1, 2004
14.247
+2.221
18.47%
jan 1, 2005
16.86
+2.613
18.34%
jan 1, 2006
18.319
+1.458
8.65%
jan 1, 2007
20.236
+1.917
10.47%
jan 1, 2008
22.264
+2.028
10.02%
jan 1, 2009
21.478
-0.786
-3.53%
jan 1, 2010
21.491
+0.013
0.06%
jan 1, 2011
20.819
-0.672
-3.13%
jan 1, 2012
22.988
+2.169
10.42%
jan 1, 2013
20.17
-2.818
-12.26%
jan 1, 2014
21.921
+1.751
8.68%
jan 1, 2015
22.299
+0.378
1.72%
jan 1, 2016
21.743
-0.555
-2.49%
Ranking of countries by current statistics by years


Comments: