29
/
en
AIzaSyAYiBZKx7MnpbEhh9jyipgxe19OcubqV5w
April 1, 2024
256121
Sweden
SWE
true
2
1
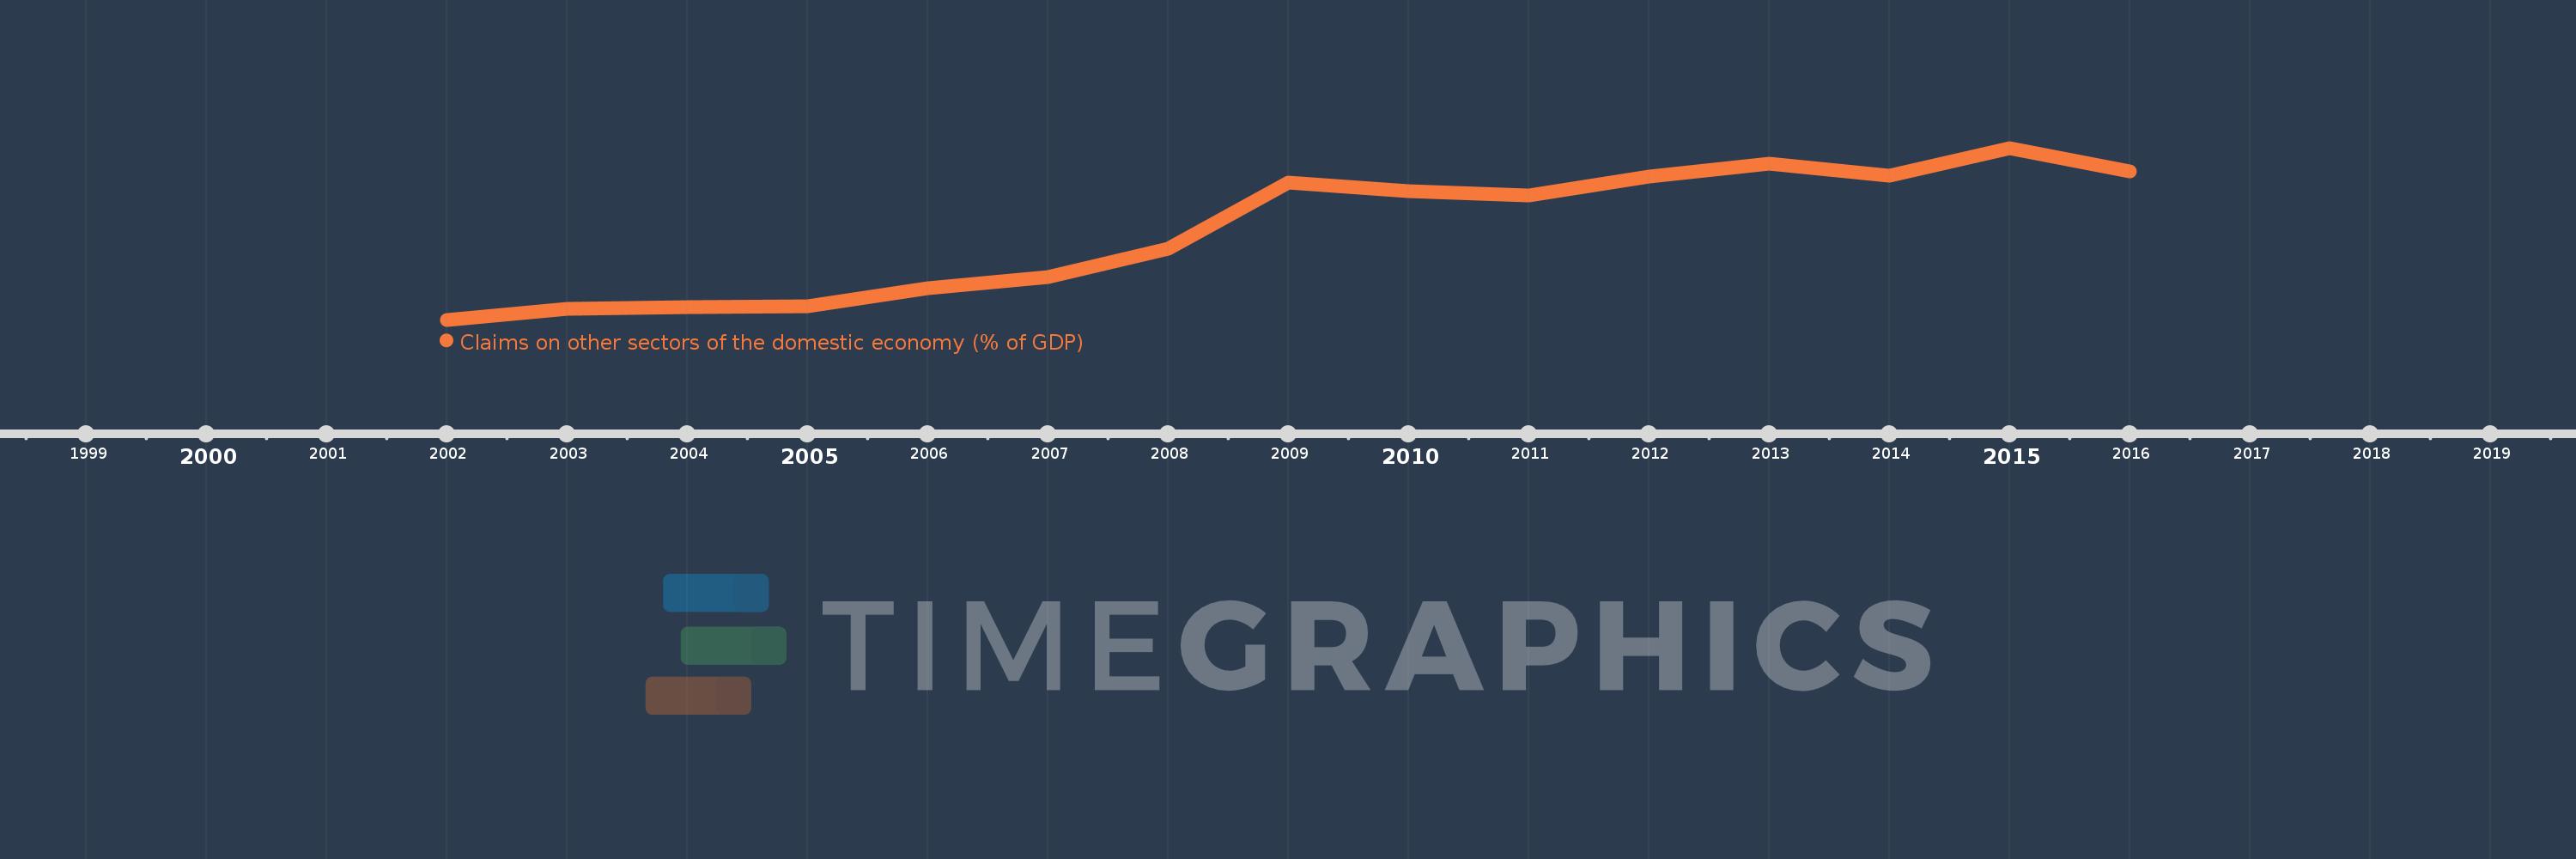
Claims on other sectors of the domestic economy (% of GDP)
2016,2015,2014,2013,2012,2011,2010,2009,2008,2007,2006,2005,2004,2003,2002
This statistics in other country:
Timeline:
This timeline shows a graph from 2002 to 2016 of Sweden. No data until 2001. Number of actual observations by date: 15.
Source name:
World Development Indicators
Source organization:
International Monetary Fund, International Financial Statistics and data files, and World Bank and OECD GDP estimates.
Categories, topics:
Financial Sector
Last updated:
apr 23, 2017
Indicators value changes by year
Minimum:
100.994
jan 1, 2002
Maximum:
159.942
jan 1, 2015
At the date of observation
Value
Absolute change
Change from previous value
jan 1, 2002
100.994
+100.994
0.0%
jan 1, 2003
104.876
+3.882
3.84%
jan 1, 2004
105.472
+0.597
0.57%
jan 1, 2005
105.71
+0.238
0.23%
jan 1, 2006
111.841
+6.13
5.8%
jan 1, 2007
115.782
+3.941
3.52%
jan 1, 2008
125.233
+9.451
8.16%
jan 1, 2009
148.01
+22.777
18.19%
jan 1, 2010
145.001
-3.009
-2.03%
jan 1, 2011
143.664
-1.337
-0.92%
jan 1, 2012
150.159
+6.495
4.52%
jan 1, 2013
154.693
+4.535
3.02%
jan 1, 2014
150.494
-4.2
-2.71%
jan 1, 2015
159.942
+9.449
6.28%
jan 1, 2016
151.986
-7.957
-4.97%
Ranking of countries by current statistics by years


Comments: