29
/
en
AIzaSyAYiBZKx7MnpbEhh9jyipgxe19OcubqV5w
April 1, 2024
132945
Finland
FIN
true
2
1
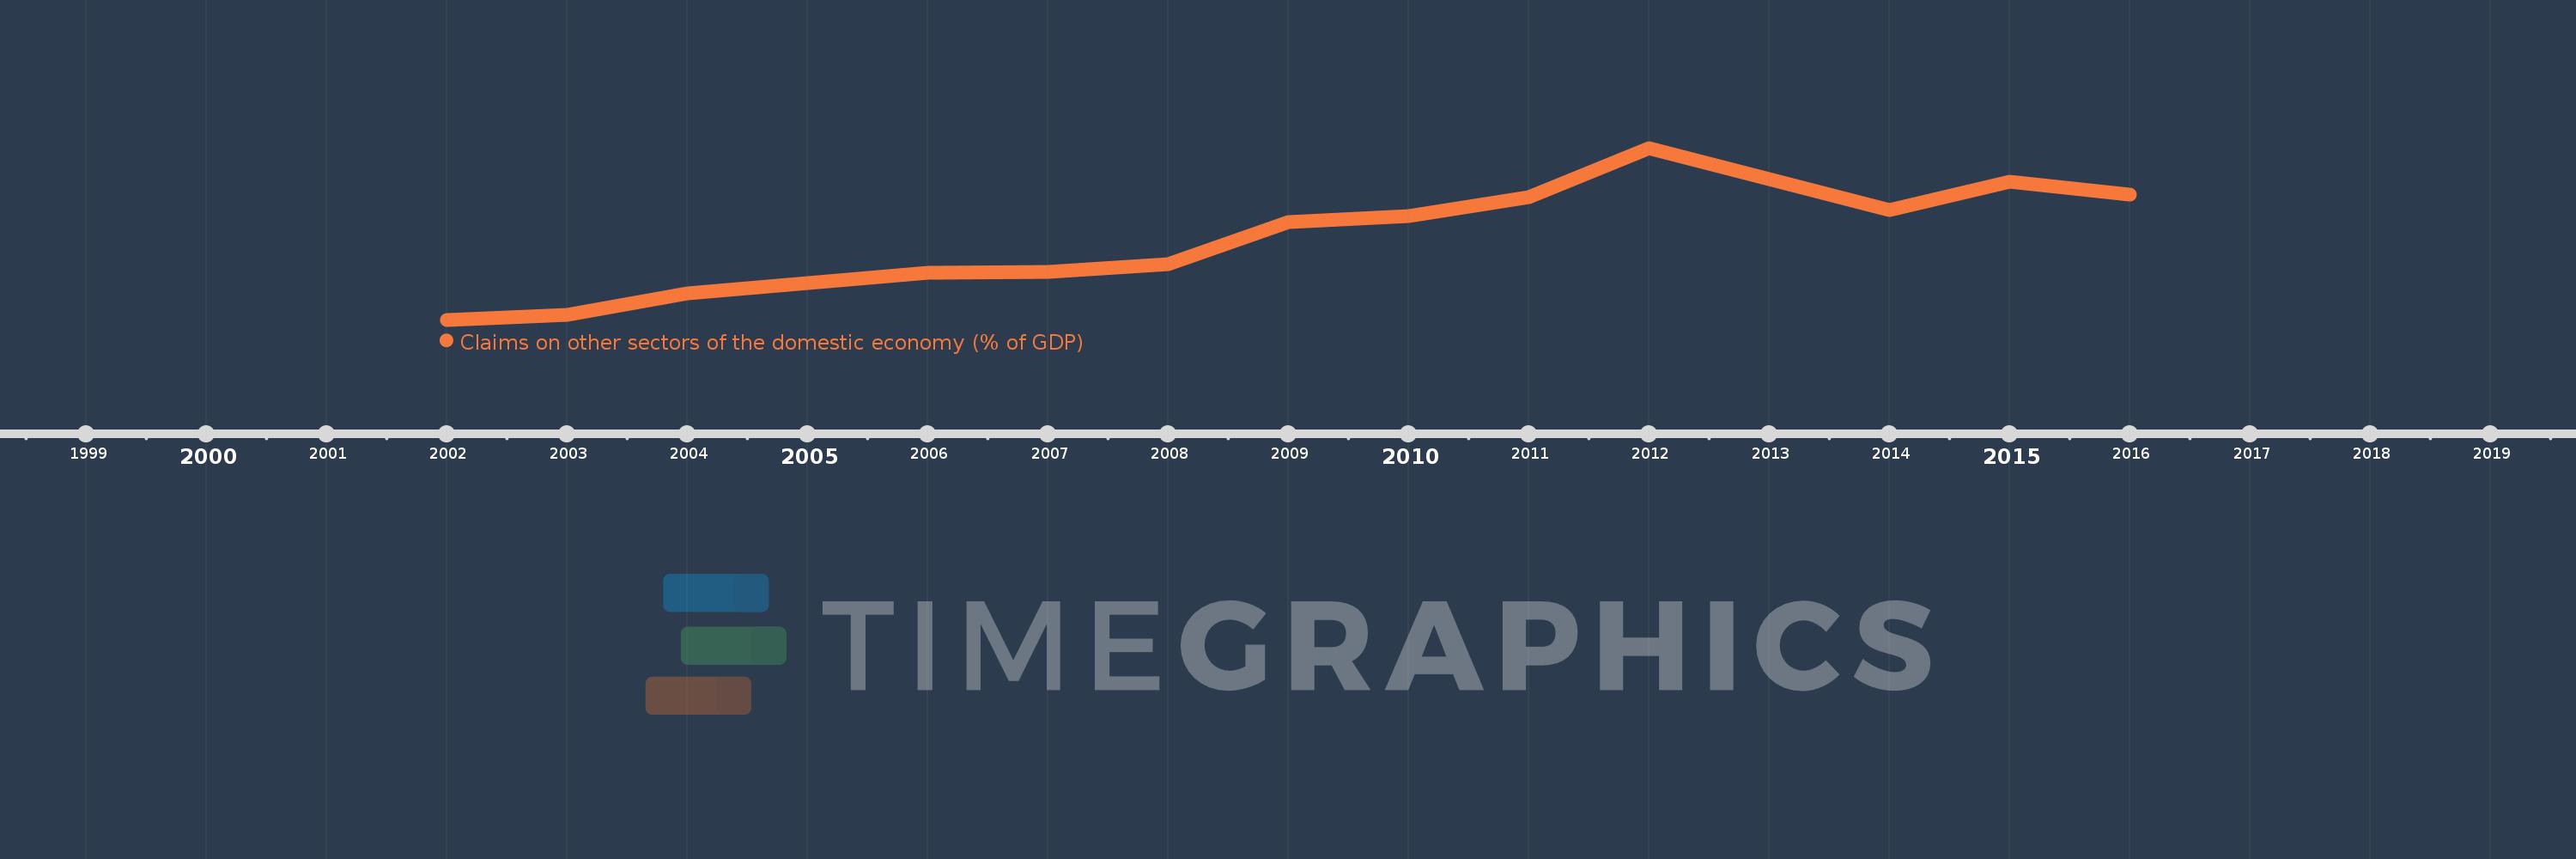
Claims on other sectors of the domestic economy (% of GDP)
2016,2015,2014,2013,2012,2011,2010,2009,2008,2007,2006,2005,2004,2003,2002
This statistics in other country:
Timeline:
This timeline shows a graph from 2002 to 2016 of Finland. No data until 2001. Number of actual observations by date: 15.
Source name:
World Development Indicators
Source organization:
International Monetary Fund, International Financial Statistics and data files, and World Bank and OECD GDP estimates.
Categories, topics:
Financial Sector
Last updated:
apr 23, 2017
Indicators value changes by year
Minimum:
55.912
jan 1, 2002
Maximum:
189.502
jan 1, 2012
At the date of observation
Value
Absolute change
Change from previous value
jan 1, 2002
55.912
+55.912
0.0%
jan 1, 2003
59.915
+4.004
7.16%
jan 1, 2004
76.168
+16.253
27.13%
jan 1, 2005
84.565
+8.397
11.02%
jan 1, 2006
92.363
+7.798
9.22%
jan 1, 2007
93.118
+0.756
0.82%
jan 1, 2008
99.023
+5.905
6.34%
jan 1, 2009
131.935
+32.912
33.24%
jan 1, 2010
136.394
+4.458
3.38%
jan 1, 2011
151.425
+15.031
11.02%
jan 1, 2012
189.502
+38.077
25.15%
jan 1, 2013
165.233
-24.269
-12.81%
jan 1, 2014
141.056
-24.176
-14.63%
jan 1, 2015
163.391
+22.335
15.83%
jan 1, 2016
152.995
-10.396
-6.36%
Ranking of countries by current statistics by years


Comments: