29
/
en
AIzaSyAYiBZKx7MnpbEhh9jyipgxe19OcubqV5w
April 1, 2024
158274
Iraq
IRQ
true
2
1
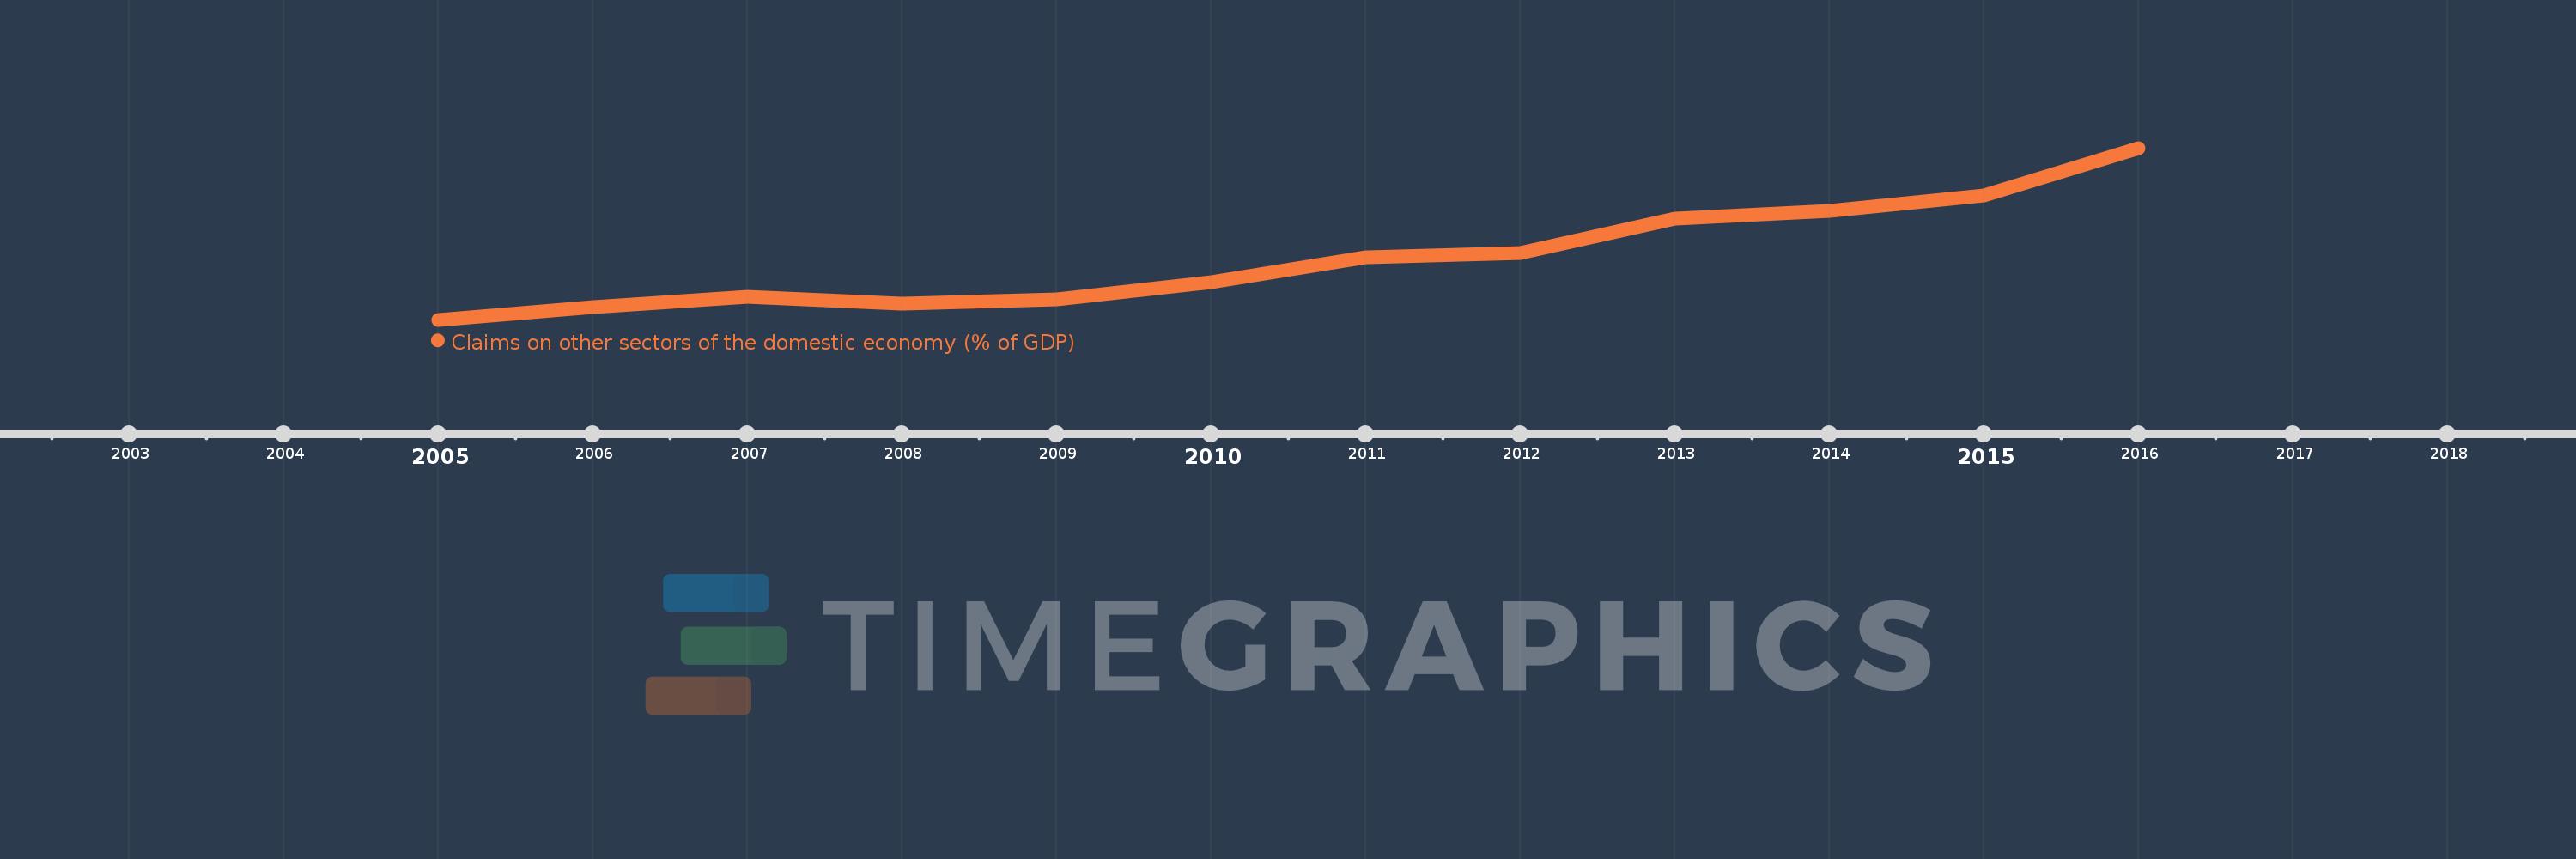
Claims on other sectors of the domestic economy (% of GDP)
2016,2015,2014,2013,2012,2011,2010,2009,2008,2007,2006,2005
This statistics in other country:
Timeline:
This timeline shows a graph from 2005 to 2016 of Iraq. No data until 2004. Number of actual observations by date: 12.
Source name:
World Development Indicators
Source organization:
International Monetary Fund, International Financial Statistics and data files, and World Bank and OECD GDP estimates.
Categories, topics:
Financial Sector
Last updated:
apr 23, 2017
Indicators value changes by year
Maximum:
12.629
jan 1, 2016
At the date of observation
Value
Absolute change
Change from previous value
jan 1, 2005
1.492
+1.492
0.0%
jan 1, 2006
2.331
+0.839
56.22%
jan 1, 2007
2.988
+0.657
28.16%
jan 1, 2008
2.555
-0.433
-14.5%
jan 1, 2009
2.804
+0.249
9.76%
jan 1, 2010
3.932
+1.128
40.24%
jan 1, 2011
5.513
+1.581
40.2%
jan 1, 2012
5.83
+0.317
5.75%
jan 1, 2013
8.049
+2.219
38.05%
jan 1, 2014
8.523
+0.475
5.9%
jan 1, 2015
9.569
+1.046
12.27%
jan 1, 2016
12.629
+3.06
31.97%
Ranking of countries by current statistics by years


Comments: