29
/
en
AIzaSyAYiBZKx7MnpbEhh9jyipgxe19OcubqV5w
April 1, 2024
110681
Congo, Rep.
COG
true
2
1
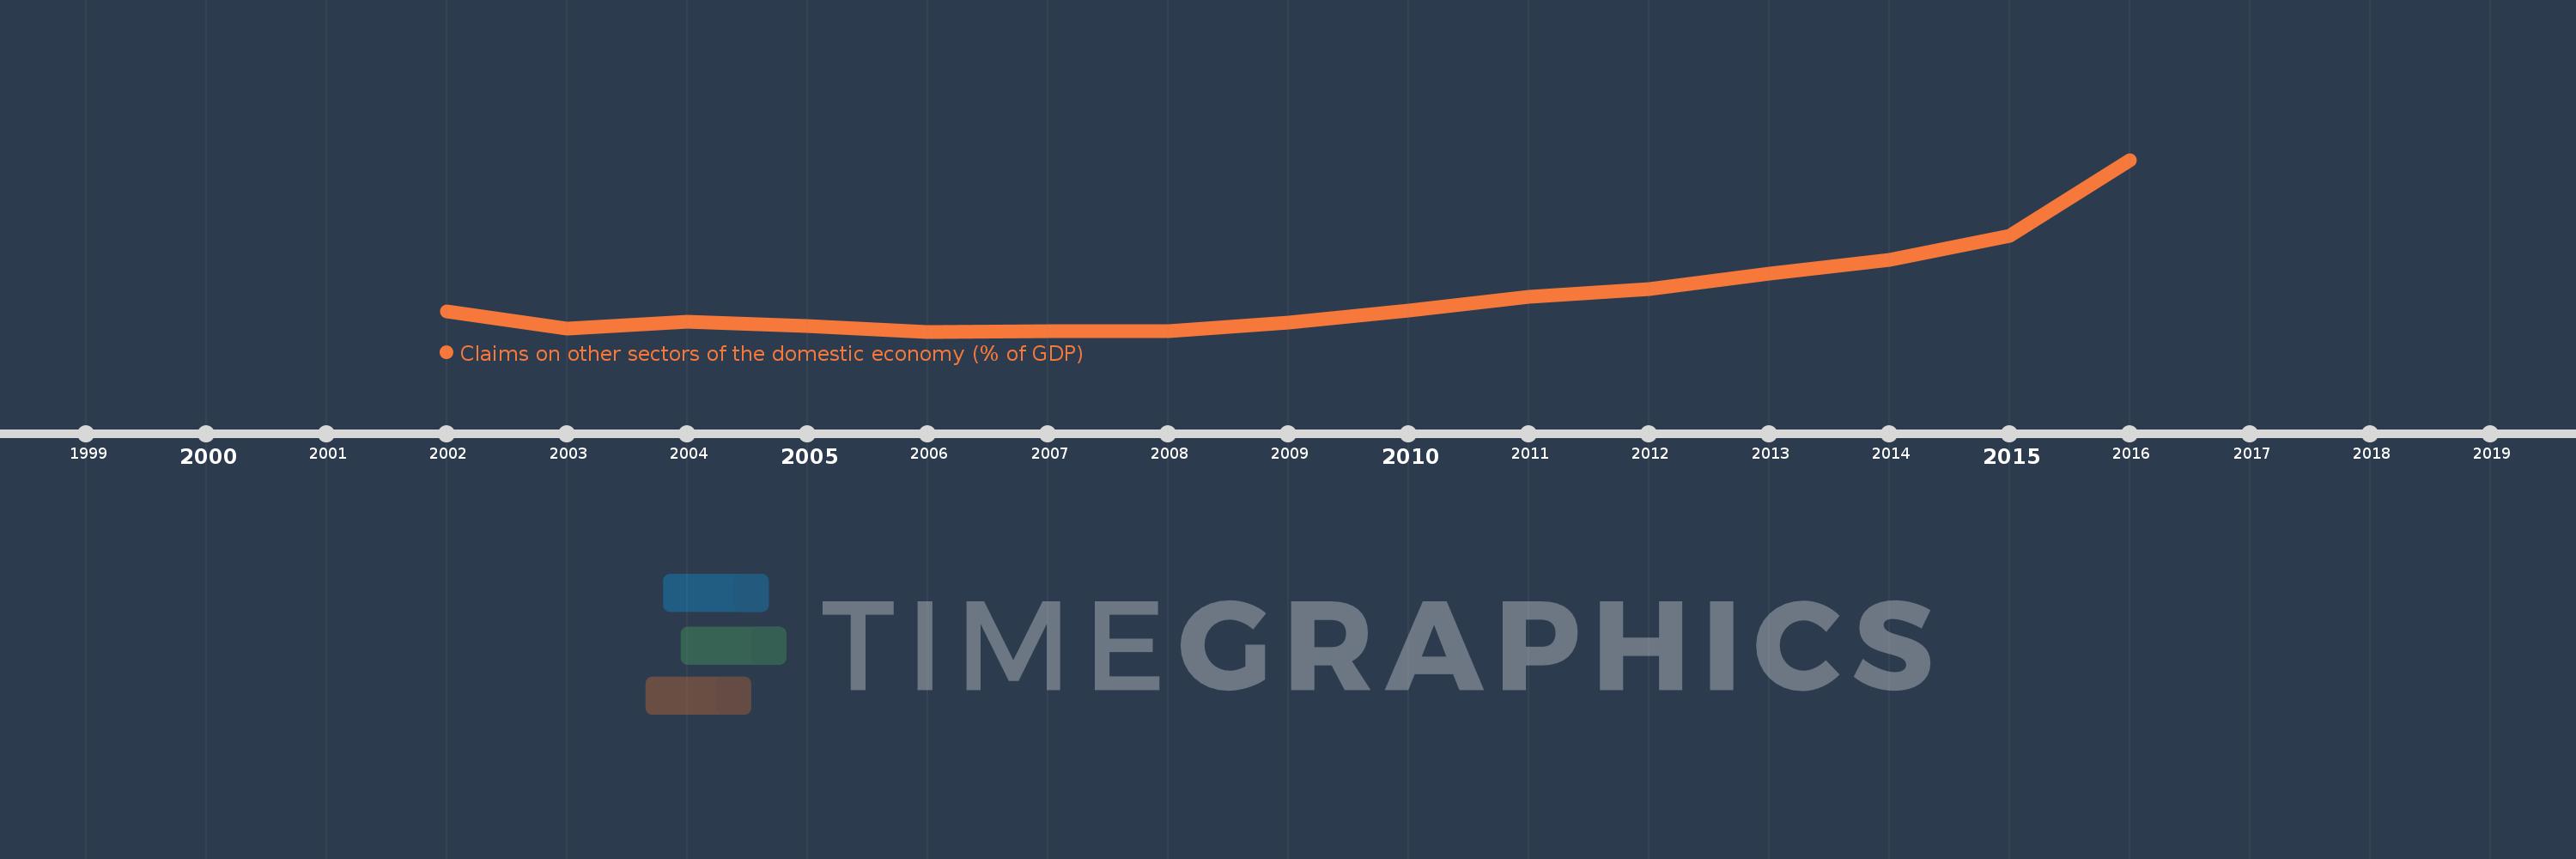
Claims on other sectors of the domestic economy (% of GDP)
2016,2015,2014,2013,2012,2011,2010,2009,2008,2007,2006,2005,2004,2003,2002
This statistics in other country:
Timeline:
This timeline shows a graph from 2002 to 2016 of Congo, Rep.. No data until 2001. Number of actual observations by date: 15.
Source name:
World Development Indicators
Source organization:
International Monetary Fund, International Financial Statistics and data files, and World Bank and OECD GDP estimates.
Categories, topics:
Financial Sector
Last updated:
apr 23, 2017
Indicators value changes by year
Maximum:
24.168
jan 1, 2016
At the date of observation
Value
Absolute change
Change from previous value
jan 1, 2002
5.239
+5.239
0.0%
jan 1, 2003
3.096
-2.143
-40.9%
jan 1, 2004
3.894
+0.797
25.75%
jan 1, 2005
3.379
-0.515
-13.23%
jan 1, 2006
2.679
-0.699
-20.7%
jan 1, 2007
2.688
+0.008
0.31%
jan 1, 2008
2.771
+0.084
3.11%
jan 1, 2009
3.828
+1.056
38.12%
jan 1, 2010
5.354
+1.527
39.88%
jan 1, 2011
6.979
+1.624
30.34%
jan 1, 2012
7.986
+1.007
14.44%
jan 1, 2013
9.912
+1.926
24.11%
jan 1, 2014
11.631
+1.719
17.35%
jan 1, 2015
14.675
+3.044
26.17%
jan 1, 2016
24.168
+9.492
64.68%
Ranking of countries by current statistics by years


Comments: