29
/
en
AIzaSyAYiBZKx7MnpbEhh9jyipgxe19OcubqV5w
April 1, 2024
118708
Denmark
DNK
true
2
1
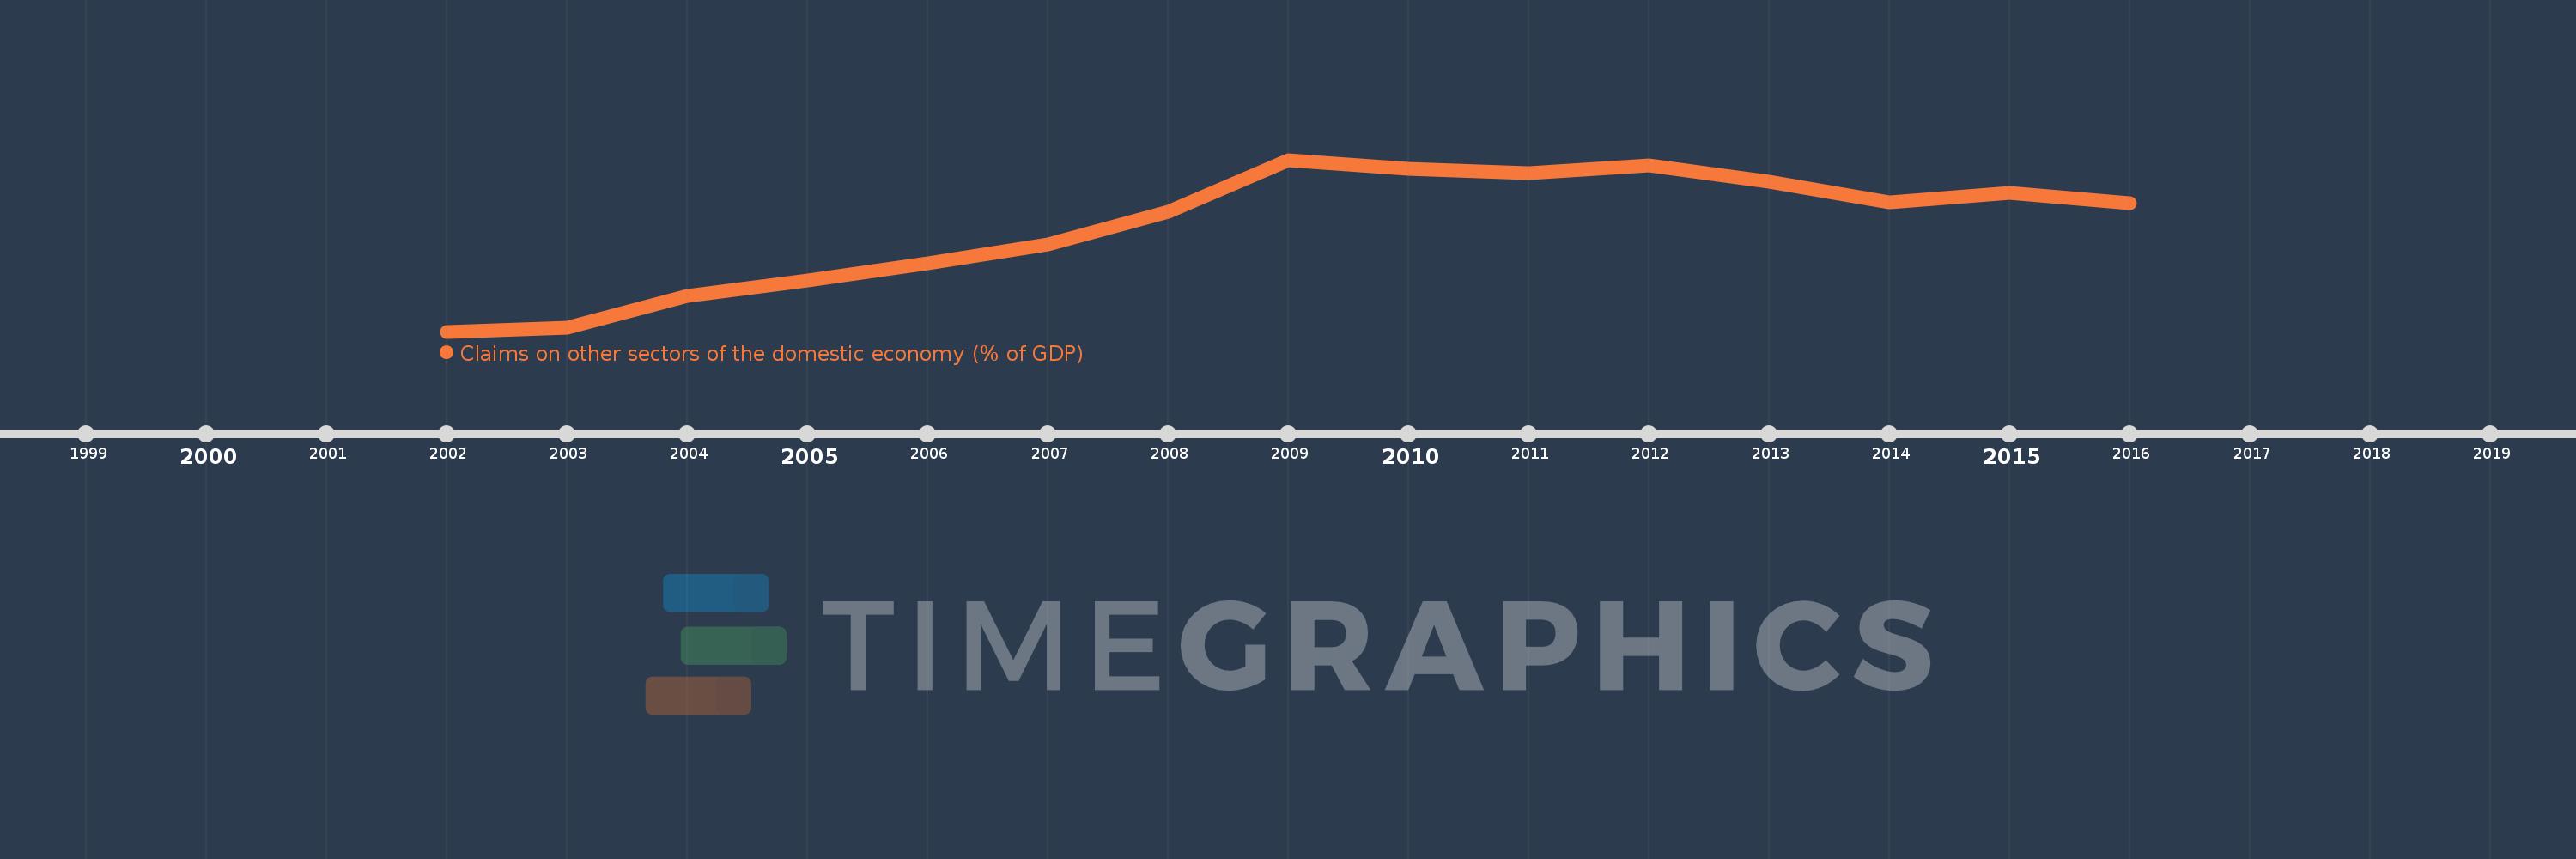
Claims on other sectors of the domestic economy (% of GDP)
2016,2015,2014,2013,2012,2011,2010,2009,2008,2007,2006,2005,2004,2003,2002
This statistics in other country:
Timeline:
This timeline shows a graph from 2002 to 2016 of Denmark. No data until 2001. Number of actual observations by date: 15.
Source name:
World Development Indicators
Source organization:
International Monetary Fund, International Financial Statistics and data files, and World Bank and OECD GDP estimates.
Categories, topics:
Financial Sector
Last updated:
apr 23, 2017
Indicators value changes by year
Minimum:
138.83
jan 1, 2002
At the date of observation
Value
Absolute change
Change from previous value
jan 1, 2002
138.83
+138.83
0.0%
jan 1, 2003
141.603
+2.773
2.0%
jan 1, 2004
162.212
+20.609
14.55%
jan 1, 2005
172.594
+10.382
6.4%
jan 1, 2006
184.219
+11.624
6.74%
jan 1, 2007
196.641
+12.422
6.74%
jan 1, 2008
218.138
+21.497
10.93%
jan 1, 2009
252.8
+34.662
15.89%
jan 1, 2010
246.799
-6.001
-2.37%
jan 1, 2011
243.794
-3.005
-1.22%
jan 1, 2012
249.178
+5.383
2.21%
jan 1, 2013
238.203
-10.975
-4.4%
jan 1, 2014
224.378
-13.825
-5.8%
jan 1, 2015
230.698
+6.32
2.82%
jan 1, 2016
224.084
-6.614
-2.87%
Ranking of countries by current statistics by years


Comments: