29
/
en
AIzaSyAYiBZKx7MnpbEhh9jyipgxe19OcubqV5w
April 1, 2024
153350
Iceland
ISL
true
2
1
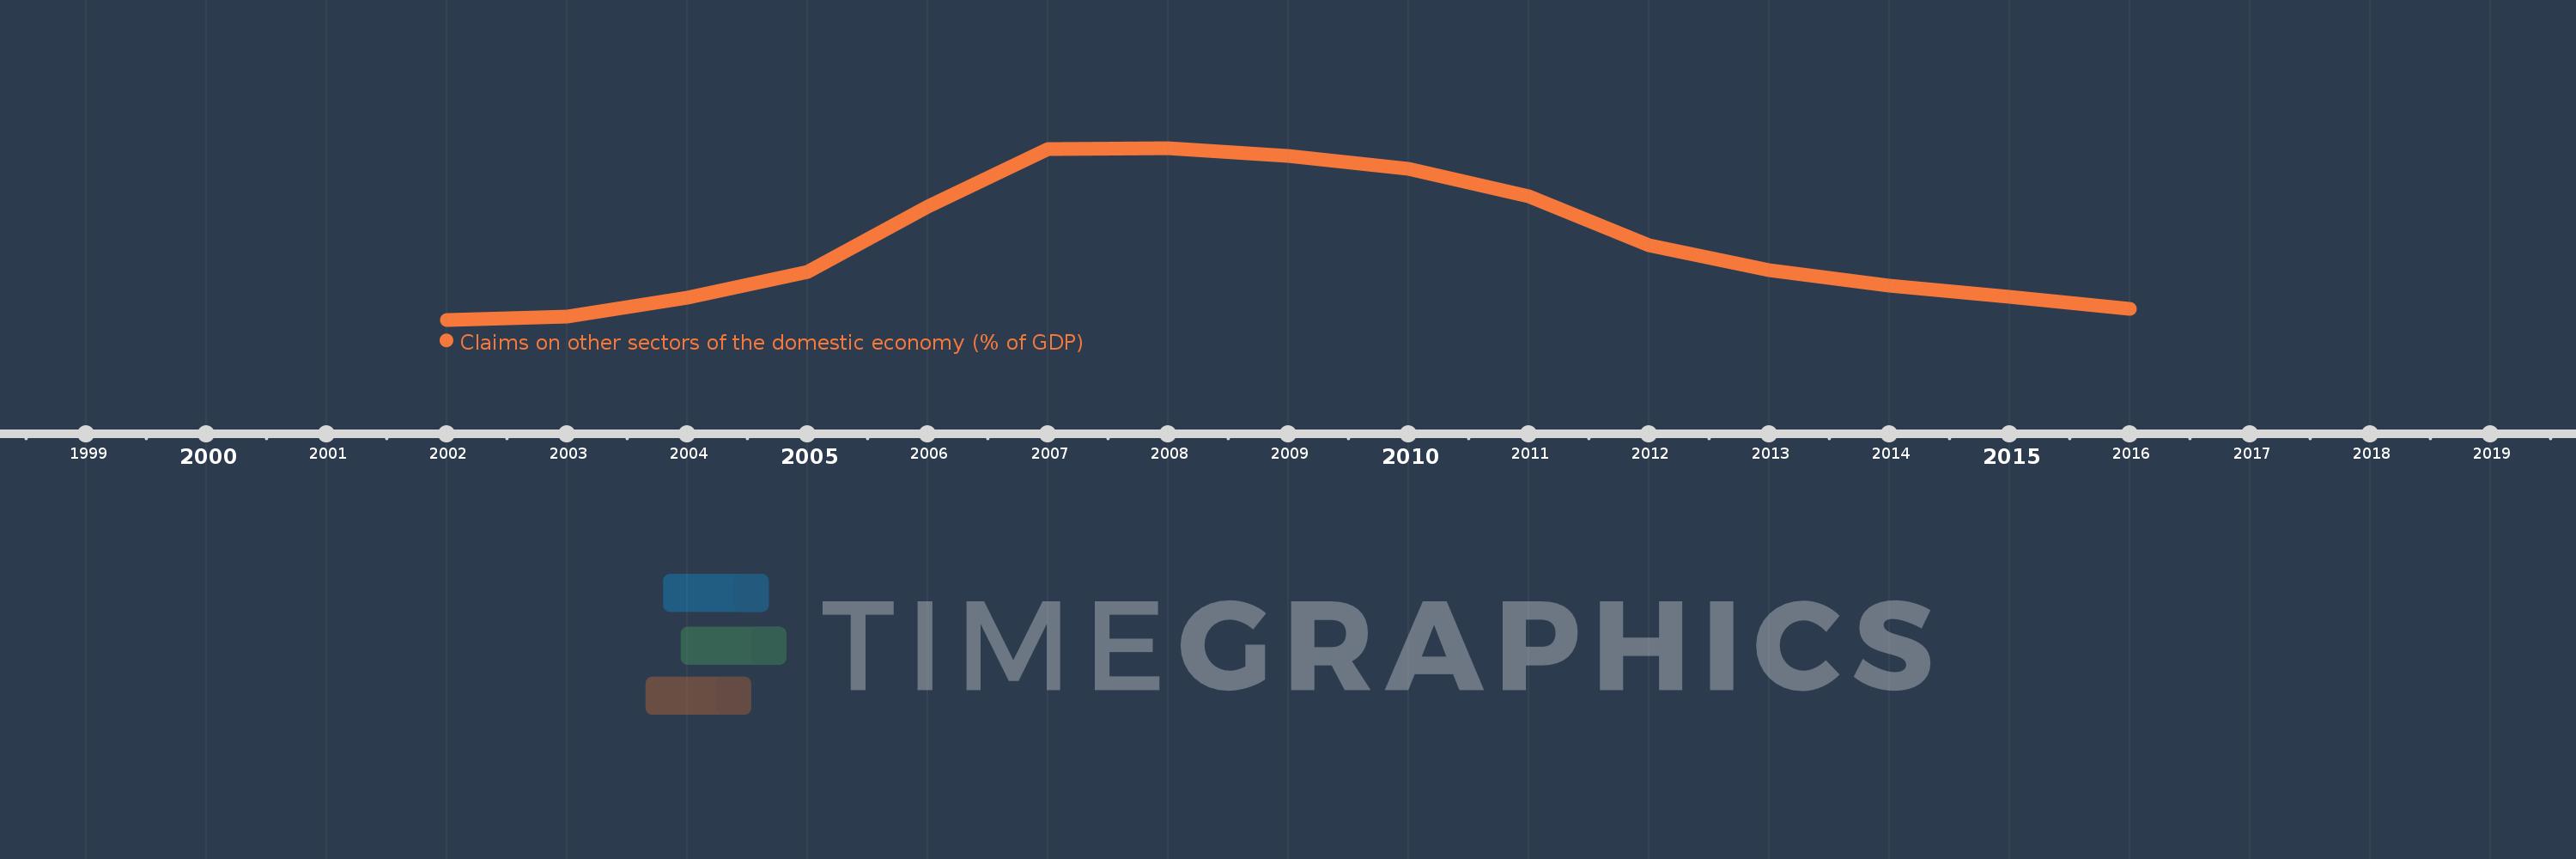
Claims on other sectors of the domestic economy (% of GDP)
2016,2015,2014,2013,2012,2011,2010,2009,2008,2007,2006,2005,2004,2003,2002
This statistics in other country:
Timeline:
This timeline shows a graph from 2002 to 2016 of Iceland. No data until 2001. Number of actual observations by date: 15.
Source name:
World Development Indicators
Source organization:
International Monetary Fund, International Financial Statistics and data files, and World Bank and OECD GDP estimates.
Categories, topics:
Financial Sector
Last updated:
apr 23, 2017
Indicators value changes by year
Minimum:
99.527
jan 1, 2002
Maximum:
315.675
jan 1, 2008
At the date of observation
Value
Absolute change
Change from previous value
jan 1, 2002
99.527
+99.527
0.0%
jan 1, 2003
103.259
+3.732
3.75%
jan 1, 2004
127.1
+23.841
23.09%
jan 1, 2005
160.129
+33.029
25.99%
jan 1, 2006
242.176
+82.047
51.24%
jan 1, 2007
314.548
+72.372
29.88%
jan 1, 2008
315.675
+1.127
0.36%
jan 1, 2009
305.419
-10.256
-3.25%
jan 1, 2010
289.455
-15.964
-5.23%
jan 1, 2011
255.027
-34.427
-11.89%
jan 1, 2012
192.733
-62.294
-24.43%
jan 1, 2013
162.426
-30.307
-15.73%
jan 1, 2014
142.828
-19.598
-12.07%
jan 1, 2015
128.54
-14.288
-10.0%
jan 1, 2016
113.781
-14.76
-11.48%
Ranking of countries by current statistics by years


Comments: