29
/
en
AIzaSyAYiBZKx7MnpbEhh9jyipgxe19OcubqV5w
April 1, 2024
85682
Bhutan
BTN
true
2
1
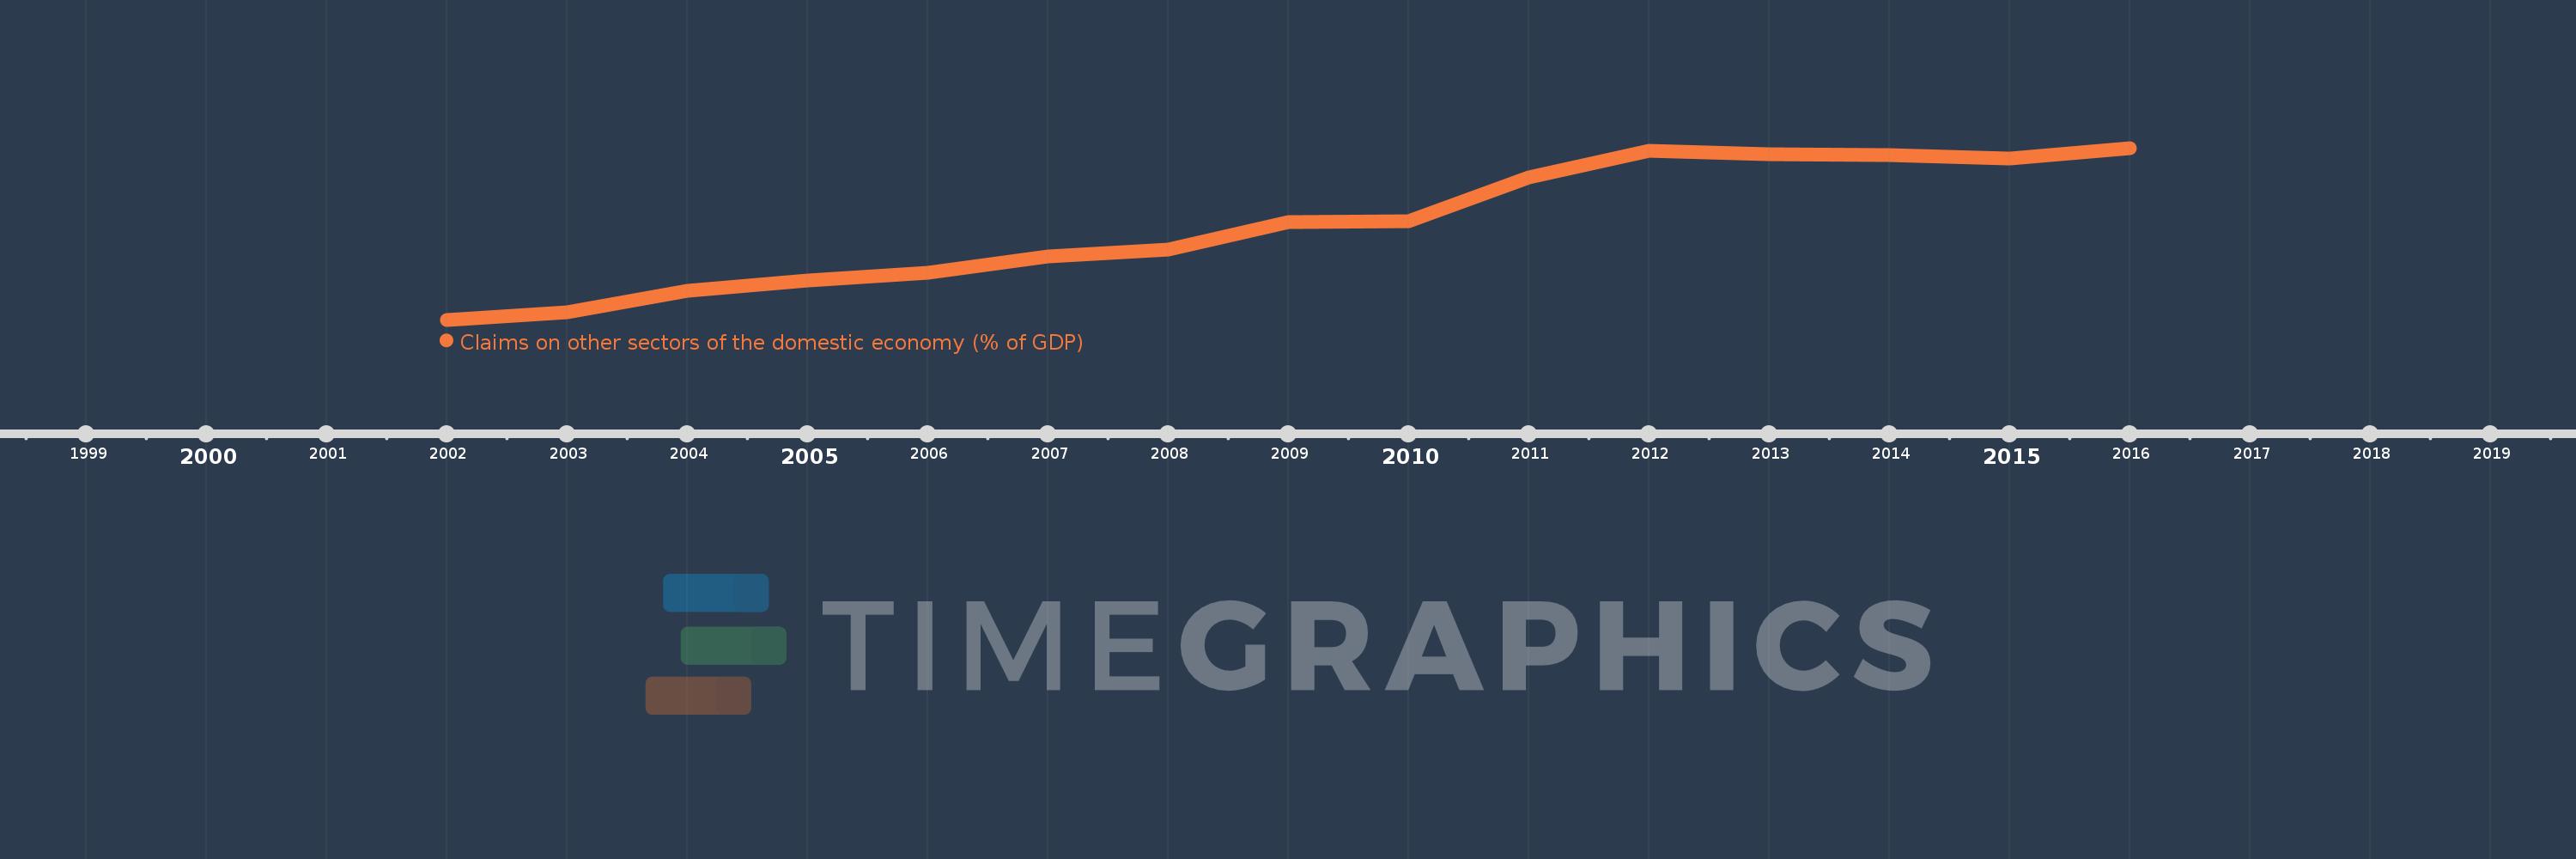
Claims on other sectors of the domestic economy (% of GDP)
2016,2015,2014,2013,2012,2011,2010,2009,2008,2007,2006,2005,2004,2003,2002
This statistics in other country:
Timeline:
This timeline shows a graph from 2002 to 2016 of Bhutan. No data until 2001. Number of actual observations by date: 15.
Source name:
World Development Indicators
Source organization:
International Monetary Fund, International Financial Statistics and data files, and World Bank and OECD GDP estimates.
Categories, topics:
Financial Sector
Last updated:
apr 23, 2017
Indicators value changes by year
Minimum:
12.434
jan 1, 2002
Maximum:
49.561
jan 1, 2016
At the date of observation
Value
Absolute change
Change from previous value
jan 1, 2002
12.434
+12.434
0.0%
jan 1, 2003
14.034
+1.6
12.87%
jan 1, 2004
18.63
+4.596
32.75%
jan 1, 2005
20.968
+2.337
12.55%
jan 1, 2006
22.52
+1.552
7.4%
jan 1, 2007
26.08
+3.56
15.81%
jan 1, 2008
27.647
+1.567
6.01%
jan 1, 2009
33.569
+5.922
21.42%
jan 1, 2010
33.674
+0.105
0.31%
jan 1, 2011
43.156
+9.481
28.16%
jan 1, 2012
48.944
+5.788
13.41%
jan 1, 2013
48.16
-0.784
-1.6%
jan 1, 2014
47.99
-0.169
-0.35%
jan 1, 2015
47.285
-0.705
-1.47%
jan 1, 2016
49.561
+2.276
4.81%
Ranking of countries by current statistics by years


Comments: