29
/
en
AIzaSyAYiBZKx7MnpbEhh9jyipgxe19OcubqV5w
April 1, 2024
106977
Colombia
COL
true
2
1
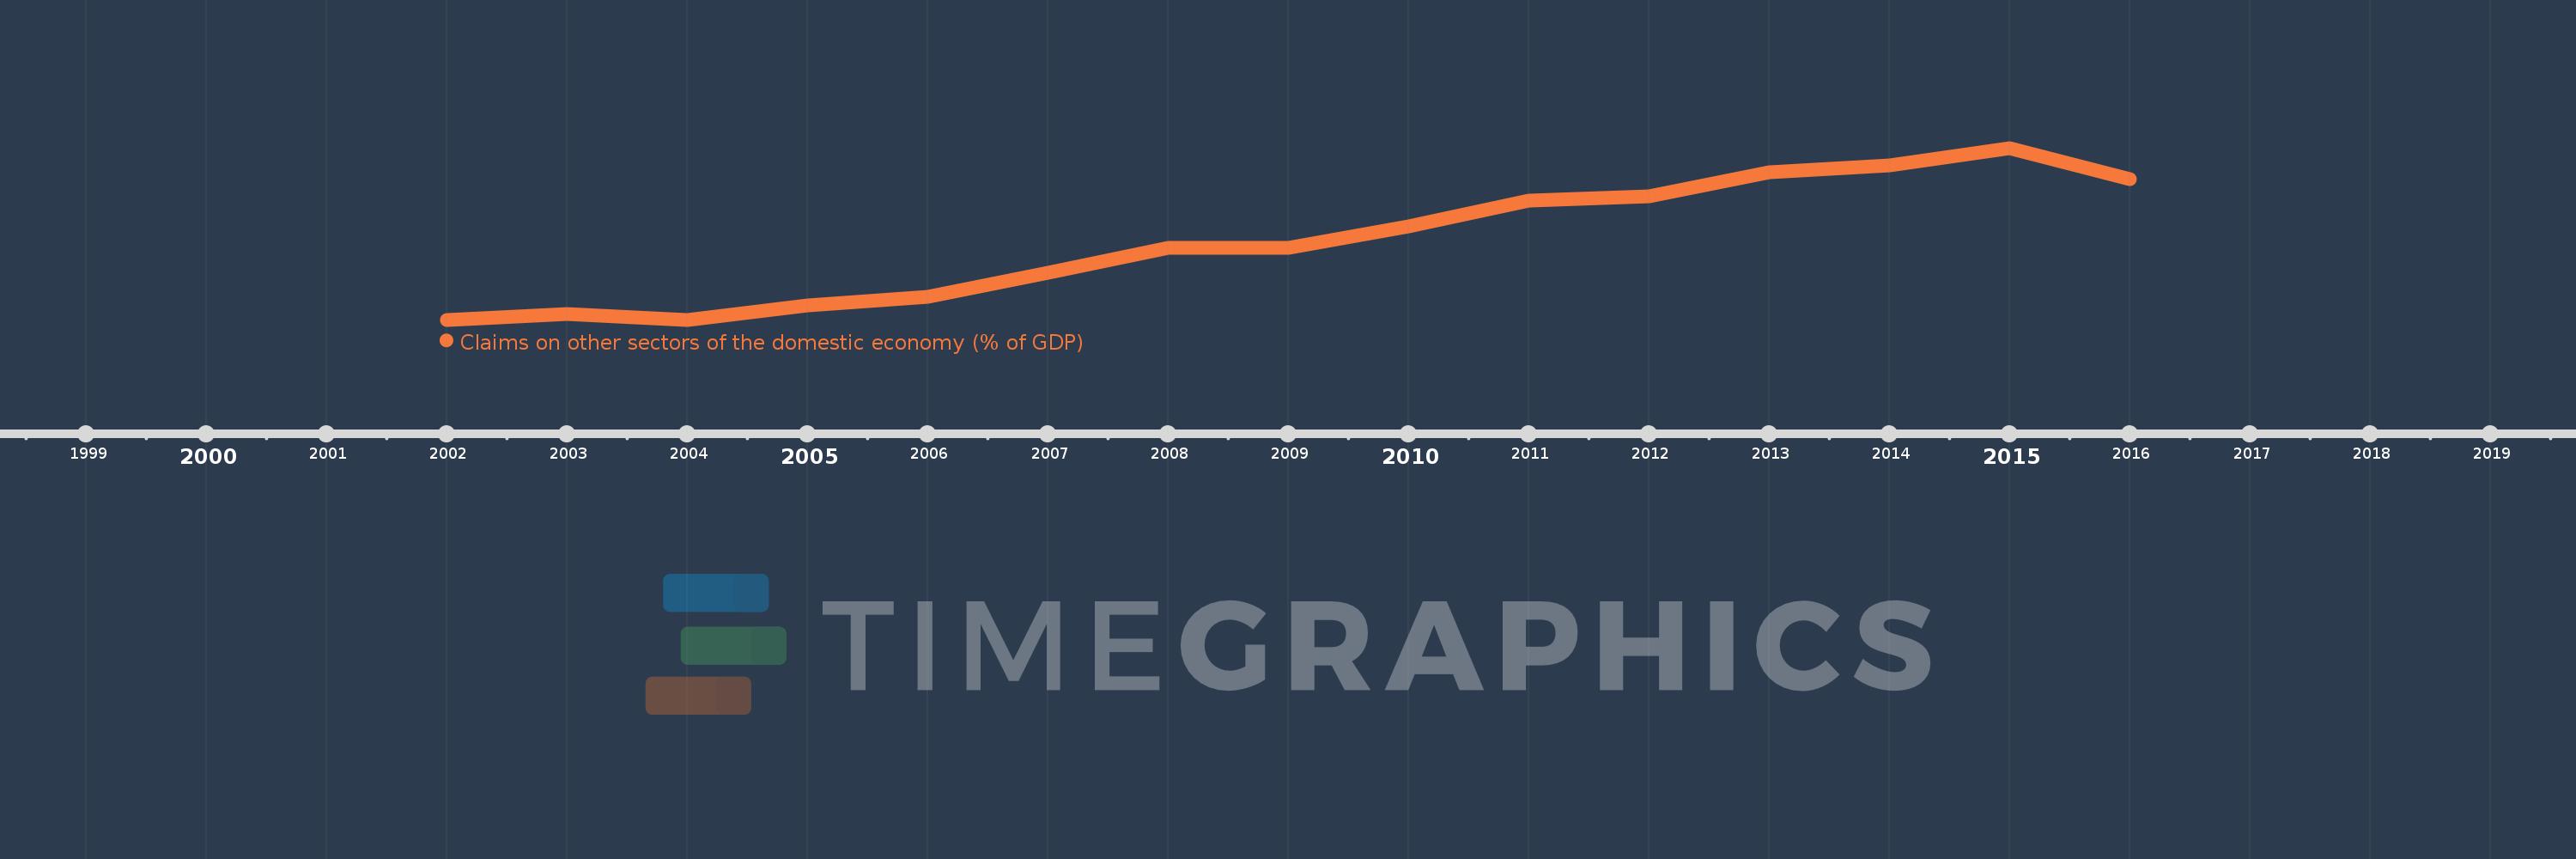
Claims on other sectors of the domestic economy (% of GDP)
2016,2015,2014,2013,2012,2011,2010,2009,2008,2007,2006,2005,2004,2003,2002
This statistics in other country:
Timeline:
This timeline shows a graph from 2002 to 2016 of Colombia. No data until 2001. Number of actual observations by date: 15.
Source name:
World Development Indicators
Source organization:
International Monetary Fund, International Financial Statistics and data files, and World Bank and OECD GDP estimates.
Categories, topics:
Financial Sector
Last updated:
apr 23, 2017
Indicators value changes by year
Minimum:
27.764
jan 1, 2004
Maximum:
55.792
jan 1, 2015
At the date of observation
Value
Absolute change
Change from previous value
jan 1, 2002
27.768
+27.768
0.0%
jan 1, 2003
28.691
+0.923
3.32%
jan 1, 2004
27.764
-0.927
-3.23%
jan 1, 2005
30.042
+2.279
8.21%
jan 1, 2006
31.484
+1.442
4.8%
jan 1, 2007
35.385
+3.901
12.39%
jan 1, 2008
39.526
+4.141
11.7%
jan 1, 2009
39.531
+0.005
0.01%
jan 1, 2010
42.962
+3.431
8.68%
jan 1, 2011
47.144
+4.182
9.73%
jan 1, 2012
47.955
+0.811
1.72%
jan 1, 2013
51.773
+3.818
7.96%
jan 1, 2014
53.008
+1.235
2.39%
jan 1, 2015
55.792
+2.785
5.25%
jan 1, 2016
50.675
-5.117
-9.17%
Ranking of countries by current statistics by years


Comments: