29
/
en
AIzaSyAYiBZKx7MnpbEhh9jyipgxe19OcubqV5w
April 1, 2024
86940
Bolivia
BOL
true
2
1
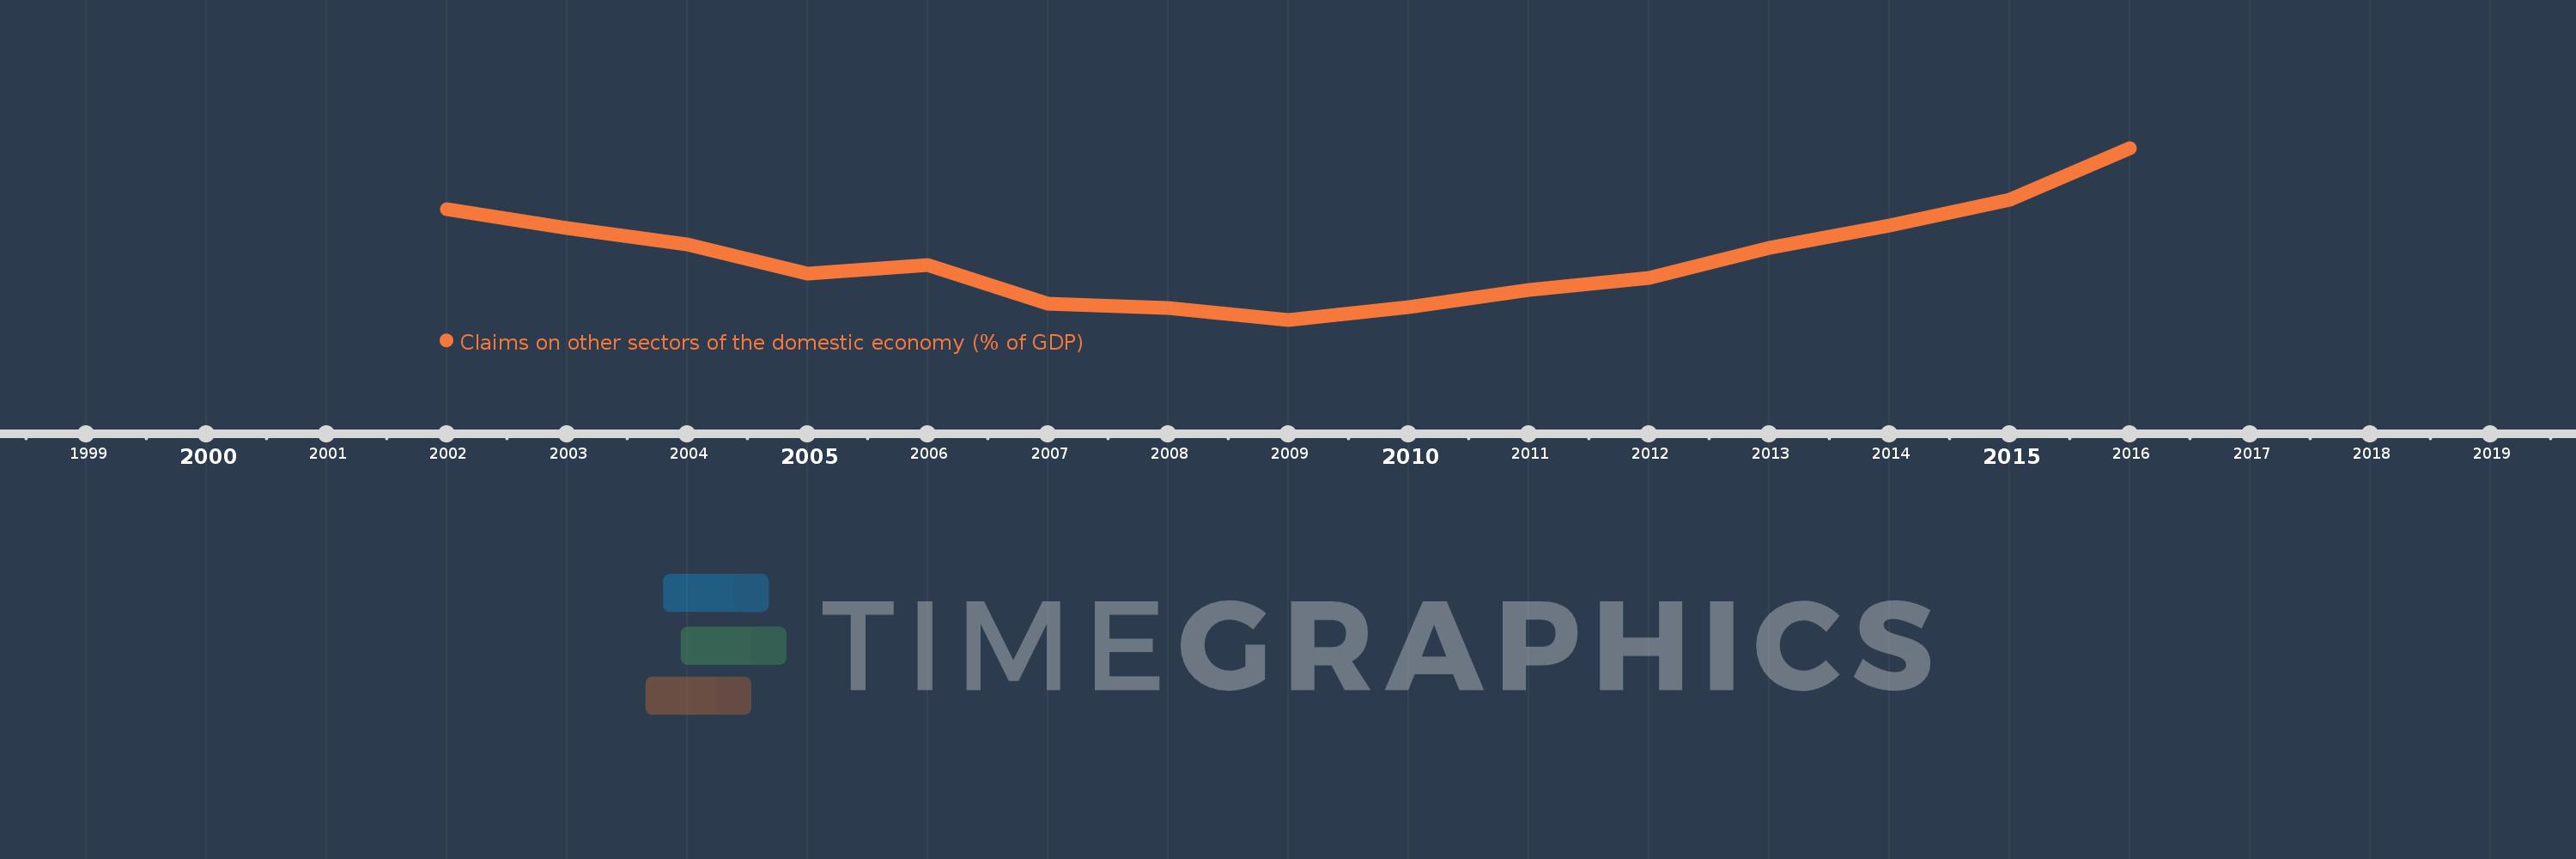
Claims on other sectors of the domestic economy (% of GDP)
2016,2015,2014,2013,2012,2011,2010,2009,2008,2007,2006,2005,2004,2003,2002
This statistics in other country:
Timeline:
This timeline shows a graph from 2002 to 2016 of Bolivia. No data until 2001. Number of actual observations by date: 15.
Source name:
World Development Indicators
Source organization:
International Monetary Fund, International Financial Statistics and data files, and World Bank and OECD GDP estimates.
Categories, topics:
Financial Sector
Last updated:
apr 23, 2017
Indicators value changes by year
Minimum:
34.959
jan 1, 2009
Maximum:
67.548
jan 1, 2016
At the date of observation
Value
Absolute change
Change from previous value
jan 1, 2002
55.909
+55.909
0.0%
jan 1, 2003
52.303
-3.606
-6.45%
jan 1, 2004
49.205
-3.098
-5.92%
jan 1, 2005
43.779
-5.426
-11.03%
jan 1, 2006
45.353
+1.574
3.6%
jan 1, 2007
38.027
-7.326
-16.15%
jan 1, 2008
37.209
-0.817
-2.15%
jan 1, 2009
34.959
-2.25
-6.05%
jan 1, 2010
37.324
+2.365
6.76%
jan 1, 2011
40.655
+3.331
8.92%
jan 1, 2012
42.975
+2.32
5.71%
jan 1, 2013
48.675
+5.701
13.27%
jan 1, 2014
52.839
+4.164
8.55%
jan 1, 2015
57.77
+4.93
9.33%
jan 1, 2016
67.548
+9.778
16.93%
Ranking of countries by current statistics by years


Comments: