29
/
en
AIzaSyAYiBZKx7MnpbEhh9jyipgxe19OcubqV5w
April 1, 2024
260619
Tanzania
TZA
true
2
1
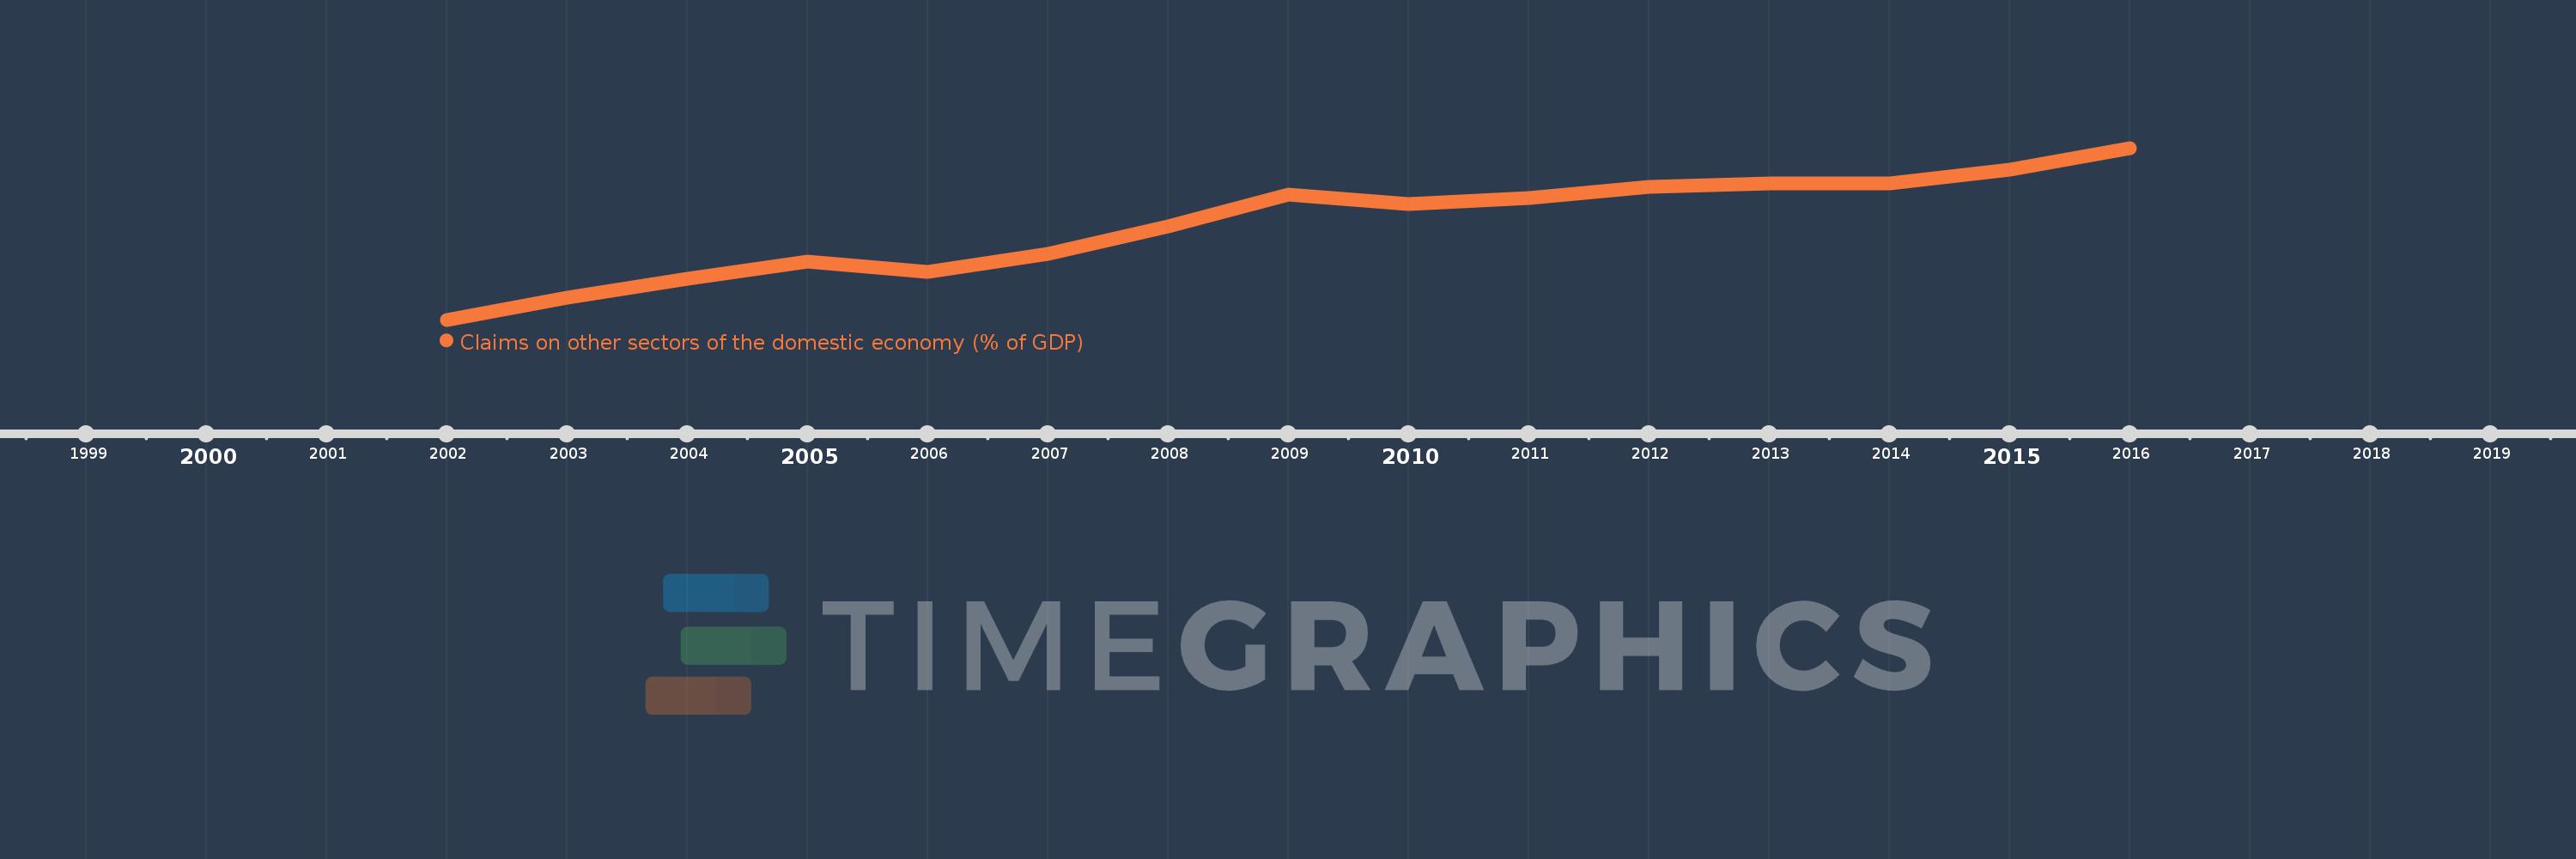
Claims on other sectors of the domestic economy (% of GDP)
2016,2015,2014,2013,2012,2011,2010,2009,2008,2007,2006,2005,2004,2003,2002
This statistics in other country:
Timeline:
This timeline shows a graph from 2002 to 2016 of Tanzania. No data until 2001. Number of actual observations by date: 15.
Source name:
World Development Indicators
Source organization:
International Monetary Fund, International Financial Statistics and data files, and World Bank and OECD GDP estimates.
Categories, topics:
Financial Sector
Last updated:
apr 23, 2017
Indicators value changes by year
Maximum:
17.051
jan 1, 2016
At the date of observation
Value
Absolute change
Change from previous value
jan 1, 2002
5.437
+5.437
0.0%
jan 1, 2003
6.937
+1.5
27.59%
jan 1, 2004
8.198
+1.261
18.18%
jan 1, 2005
9.396
+1.198
14.61%
jan 1, 2006
8.655
-0.74
-7.88%
jan 1, 2007
9.915
+1.26
14.56%
jan 1, 2008
11.771
+1.856
18.72%
jan 1, 2009
13.906
+2.134
18.13%
jan 1, 2010
13.232
-0.674
-4.85%
jan 1, 2011
13.669
+0.437
3.3%
jan 1, 2012
14.446
+0.778
5.69%
jan 1, 2013
14.667
+0.22
1.52%
jan 1, 2014
14.647
-0.02
-0.13%
jan 1, 2015
15.57
+0.923
6.3%
jan 1, 2016
17.051
+1.48
9.51%
Ranking of countries by current statistics by years


Comments: