29
/
en
AIzaSyAYiBZKx7MnpbEhh9jyipgxe19OcubqV5w
April 1, 2024
191203
Malta
MLT
true
2
1
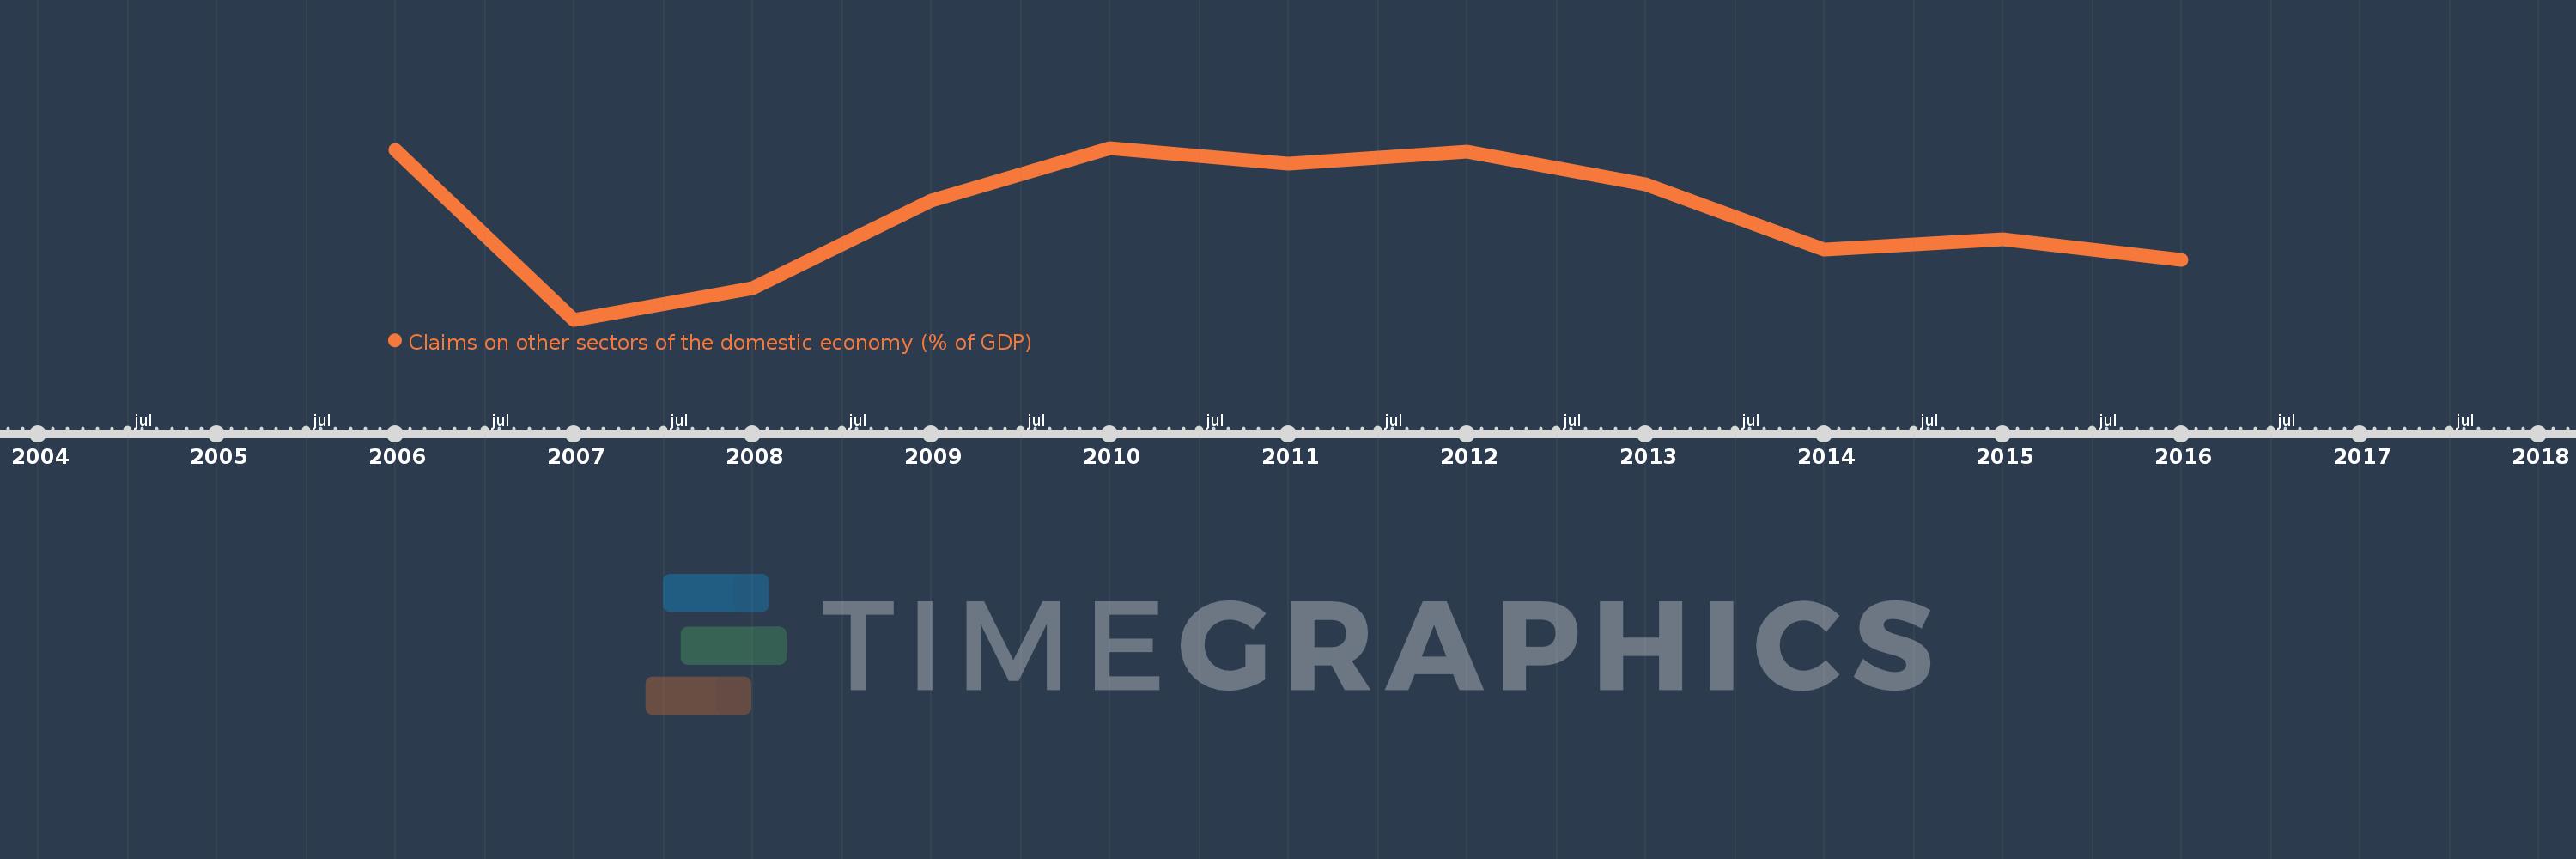
Claims on other sectors of the domestic economy (% of GDP)
2016,2015,2014,2013,2012,2011,2010,2009,2008,2007,2006
This statistics in other country:
Timeline:
This timeline shows a graph from 2006 to 2016 of Malta. No data until 2005. Number of actual observations by date: 11.
Source name:
World Development Indicators
Source organization:
International Monetary Fund, International Financial Statistics and data files, and World Bank and OECD GDP estimates.
Categories, topics:
Financial Sector
Last updated:
apr 23, 2017
Indicators value changes by year
Minimum:
109.369
jan 1, 2007
Maximum:
129.373
jan 1, 2010
At the date of observation
Value
Absolute change
Change from previous value
jan 1, 2006
129.12
+129.12
0.0%
jan 1, 2007
109.369
-19.751
-15.3%
jan 1, 2008
113.089
+3.72
3.4%
jan 1, 2009
123.244
+10.155
8.98%
jan 1, 2010
129.373
+6.129
4.97%
jan 1, 2011
127.535
-1.838
-1.42%
jan 1, 2012
128.979
+1.445
1.13%
jan 1, 2013
125.109
-3.87
-3.0%
jan 1, 2014
117.572
-7.537
-6.02%
jan 1, 2015
118.731
+1.159
0.99%
jan 1, 2016
116.32
-2.411
-2.03%
Ranking of countries by current statistics by years


Comments: