29
/
en
AIzaSyAYiBZKx7MnpbEhh9jyipgxe19OcubqV5w
April 1, 2024
139058
Germany
DEU
true
2
1
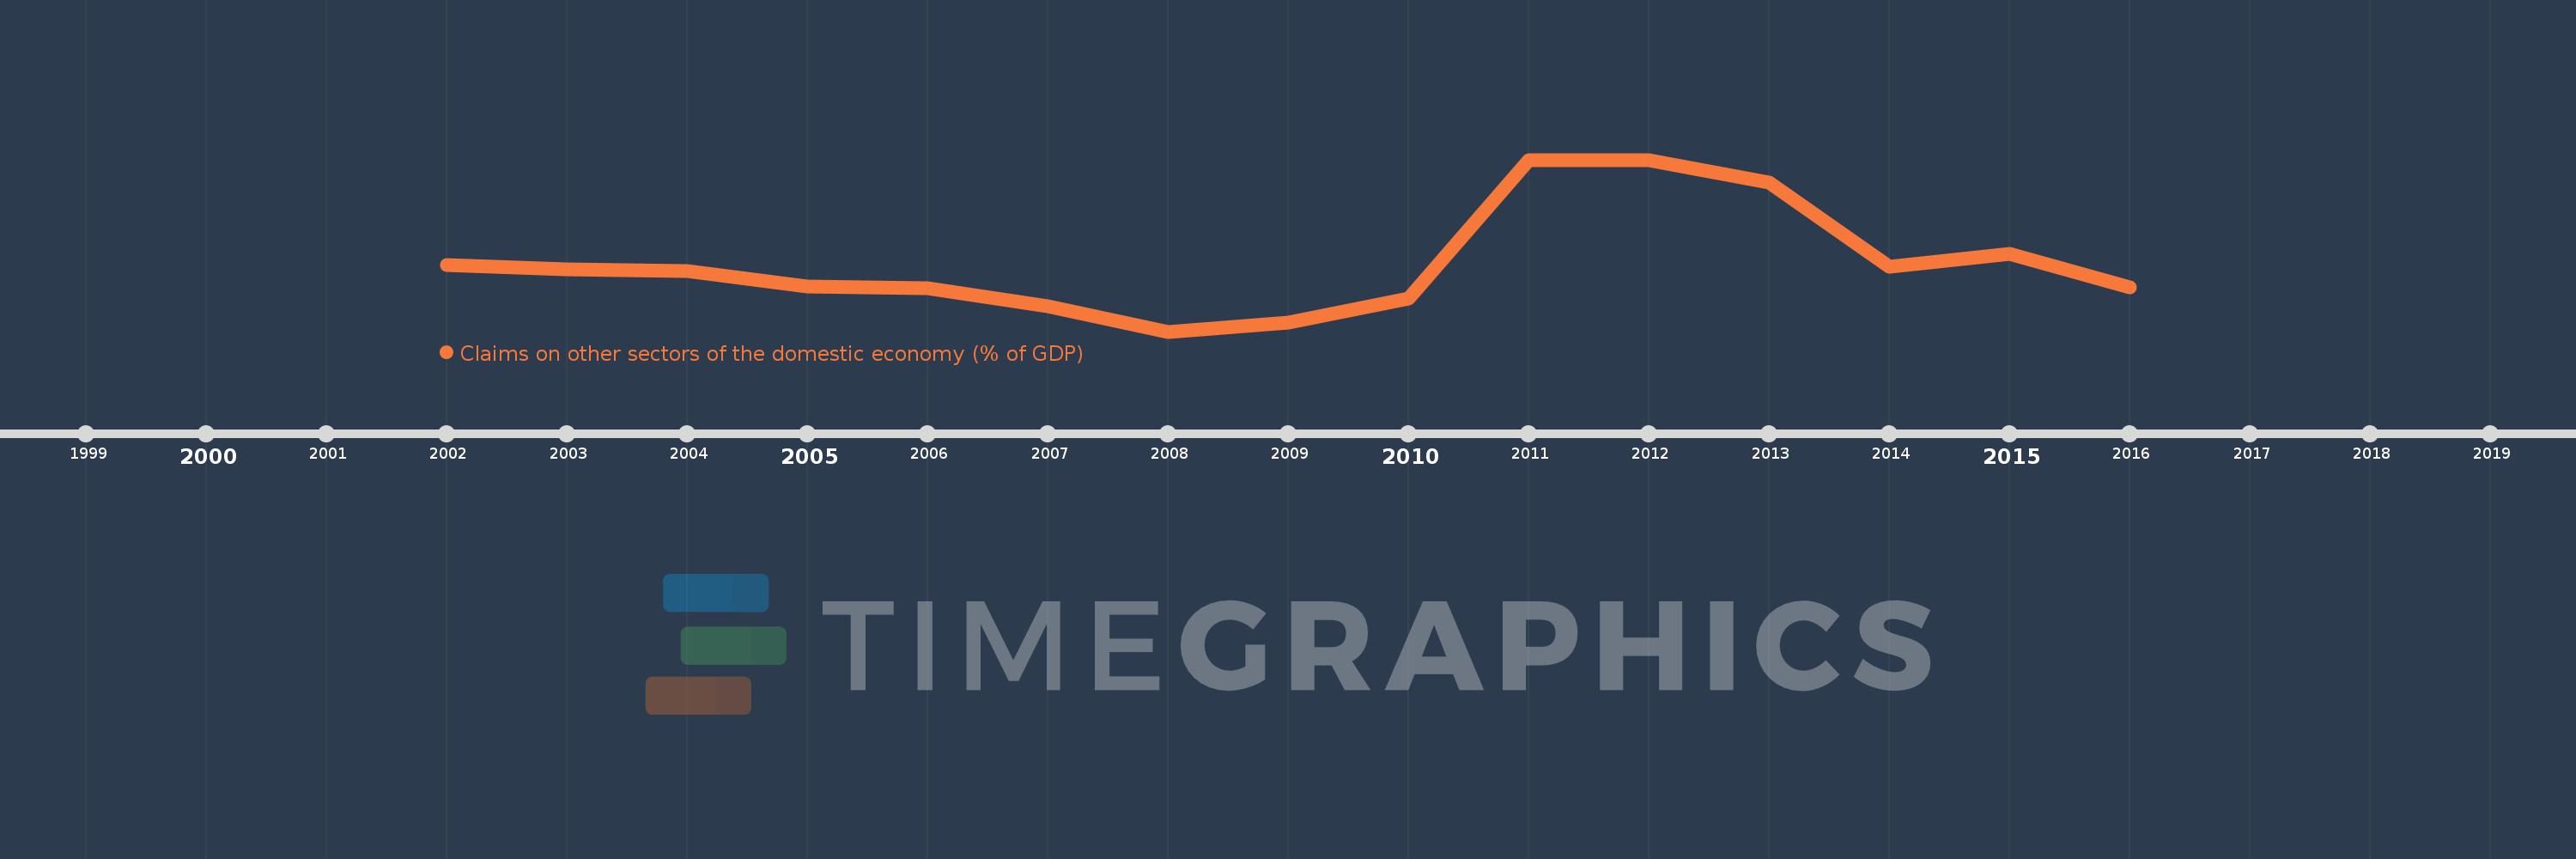
Claims on other sectors of the domestic economy (% of GDP)
2016,2015,2014,2013,2012,2011,2010,2009,2008,2007,2006,2005,2004,2003,2002
This statistics in other country:
Timeline:
This timeline shows a graph from 2002 to 2016 of Germany. No data until 2001. Number of actual observations by date: 15.
Source name:
World Development Indicators
Source organization:
International Monetary Fund, International Financial Statistics and data files, and World Bank and OECD GDP estimates.
Categories, topics:
Financial Sector
Last updated:
apr 23, 2017
Indicators value changes by year
Minimum:
120.318
jan 1, 2008
Maximum:
161.174
jan 1, 2011
At the date of observation
Value
Absolute change
Change from previous value
jan 1, 2002
136.092
+136.092
0.0%
jan 1, 2003
135.083
-1.009
-0.74%
jan 1, 2004
134.695
-0.388
-0.29%
jan 1, 2005
131.075
-3.619
-2.69%
jan 1, 2006
130.648
-0.428
-0.33%
jan 1, 2007
126.43
-4.218
-3.23%
jan 1, 2008
120.318
-6.112
-4.83%
jan 1, 2009
122.535
+2.218
1.84%
jan 1, 2010
128.249
+5.714
4.66%
jan 1, 2011
161.174
+32.925
25.67%
jan 1, 2012
161.134
-0.04
-0.02%
jan 1, 2013
155.831
-5.303
-3.29%
jan 1, 2014
135.692
-20.139
-12.92%
jan 1, 2015
138.723
+3.031
2.23%
jan 1, 2016
130.837
-7.887
-5.69%
Ranking of countries by current statistics by years


Comments: