29
/
en
AIzaSyAYiBZKx7MnpbEhh9jyipgxe19OcubqV5w
April 1, 2024
43247
Latin America & the Caribbean (IDA & IBRD countries)
TLA
false
2
1
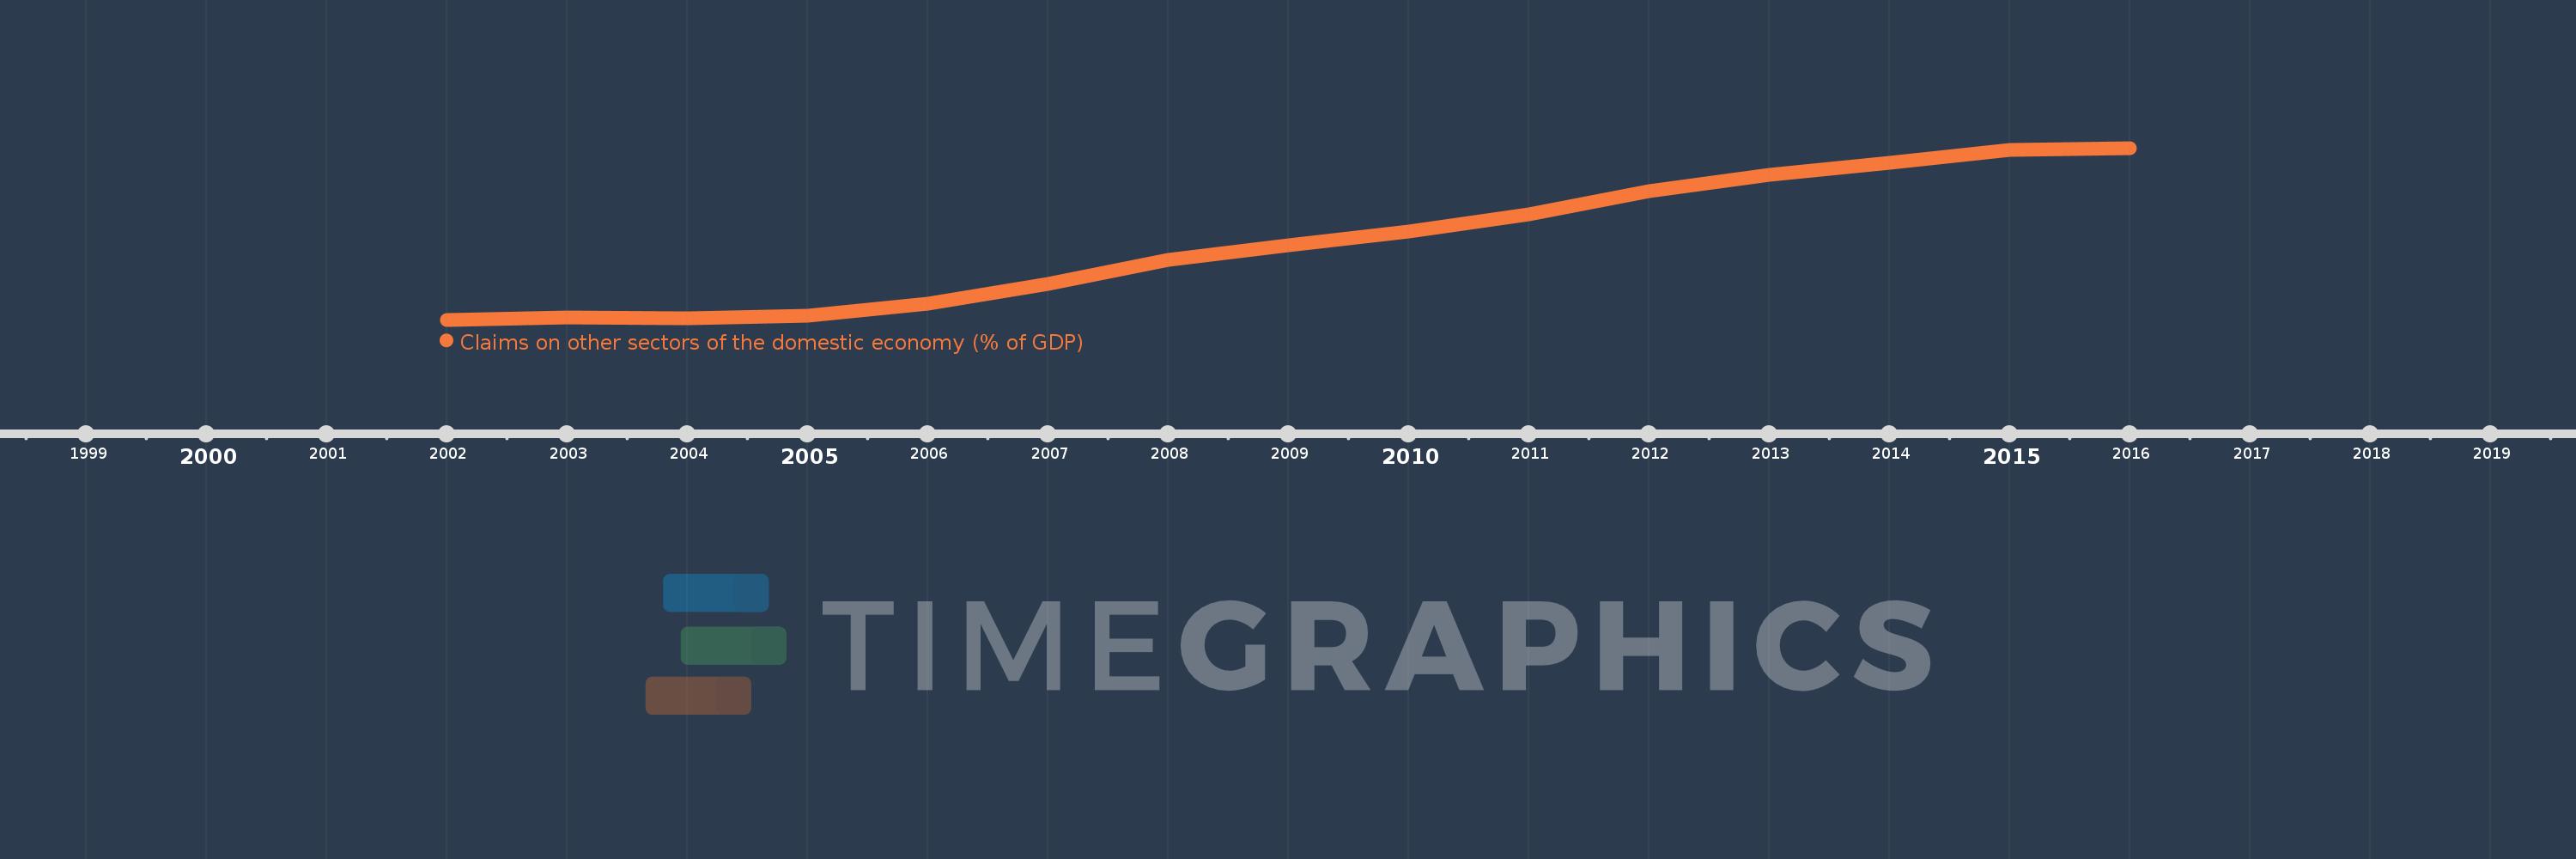
Claims on other sectors of the domestic economy (% of GDP)
2016,2015,2014,2013,2012,2011,2010,2009,2008,2007,2006,2005,2004,2003,2002
This statistics in other country:
Timeline:
This timeline shows a graph from 2002 to 2016 of Latin America & the Caribbean (IDA & IBRD countries). No data until 2001. Number of actual observations by date: 15.
Source name:
World Development Indicators
Source organization:
International Monetary Fund, International Financial Statistics and data files, and World Bank and OECD GDP estimates.
Categories, topics:
Financial Sector
Last updated:
apr 23, 2017
Indicators value changes by year
Maximum:
63.266
jan 1, 2016
At the date of observation
Value
Absolute change
Change from previous value
jan 1, 2002
26.24
+26.24
0.0%
jan 1, 2003
26.761
+0.521
1.99%
jan 1, 2004
26.526
-0.235
-0.88%
jan 1, 2005
27.198
+0.672
2.53%
jan 1, 2006
29.681
+2.483
9.13%
jan 1, 2007
33.952
+4.271
14.39%
jan 1, 2008
39.149
+5.196
15.31%
jan 1, 2009
42.298
+3.149
8.04%
jan 1, 2010
45.322
+3.024
7.15%
jan 1, 2011
48.954
+3.631
8.01%
jan 1, 2012
53.876
+4.922
10.05%
jan 1, 2013
57.418
+3.543
6.58%
jan 1, 2014
60.075
+2.656
4.63%
jan 1, 2015
62.798
+2.723
4.53%
jan 1, 2016
63.266
+0.468
0.75%
Ranking of countries by current statistics by years


Comments: