29
/
en
AIzaSyAYiBZKx7MnpbEhh9jyipgxe19OcubqV5w
April 1, 2024
121866
Dominican Republic
DOM
true
2
1
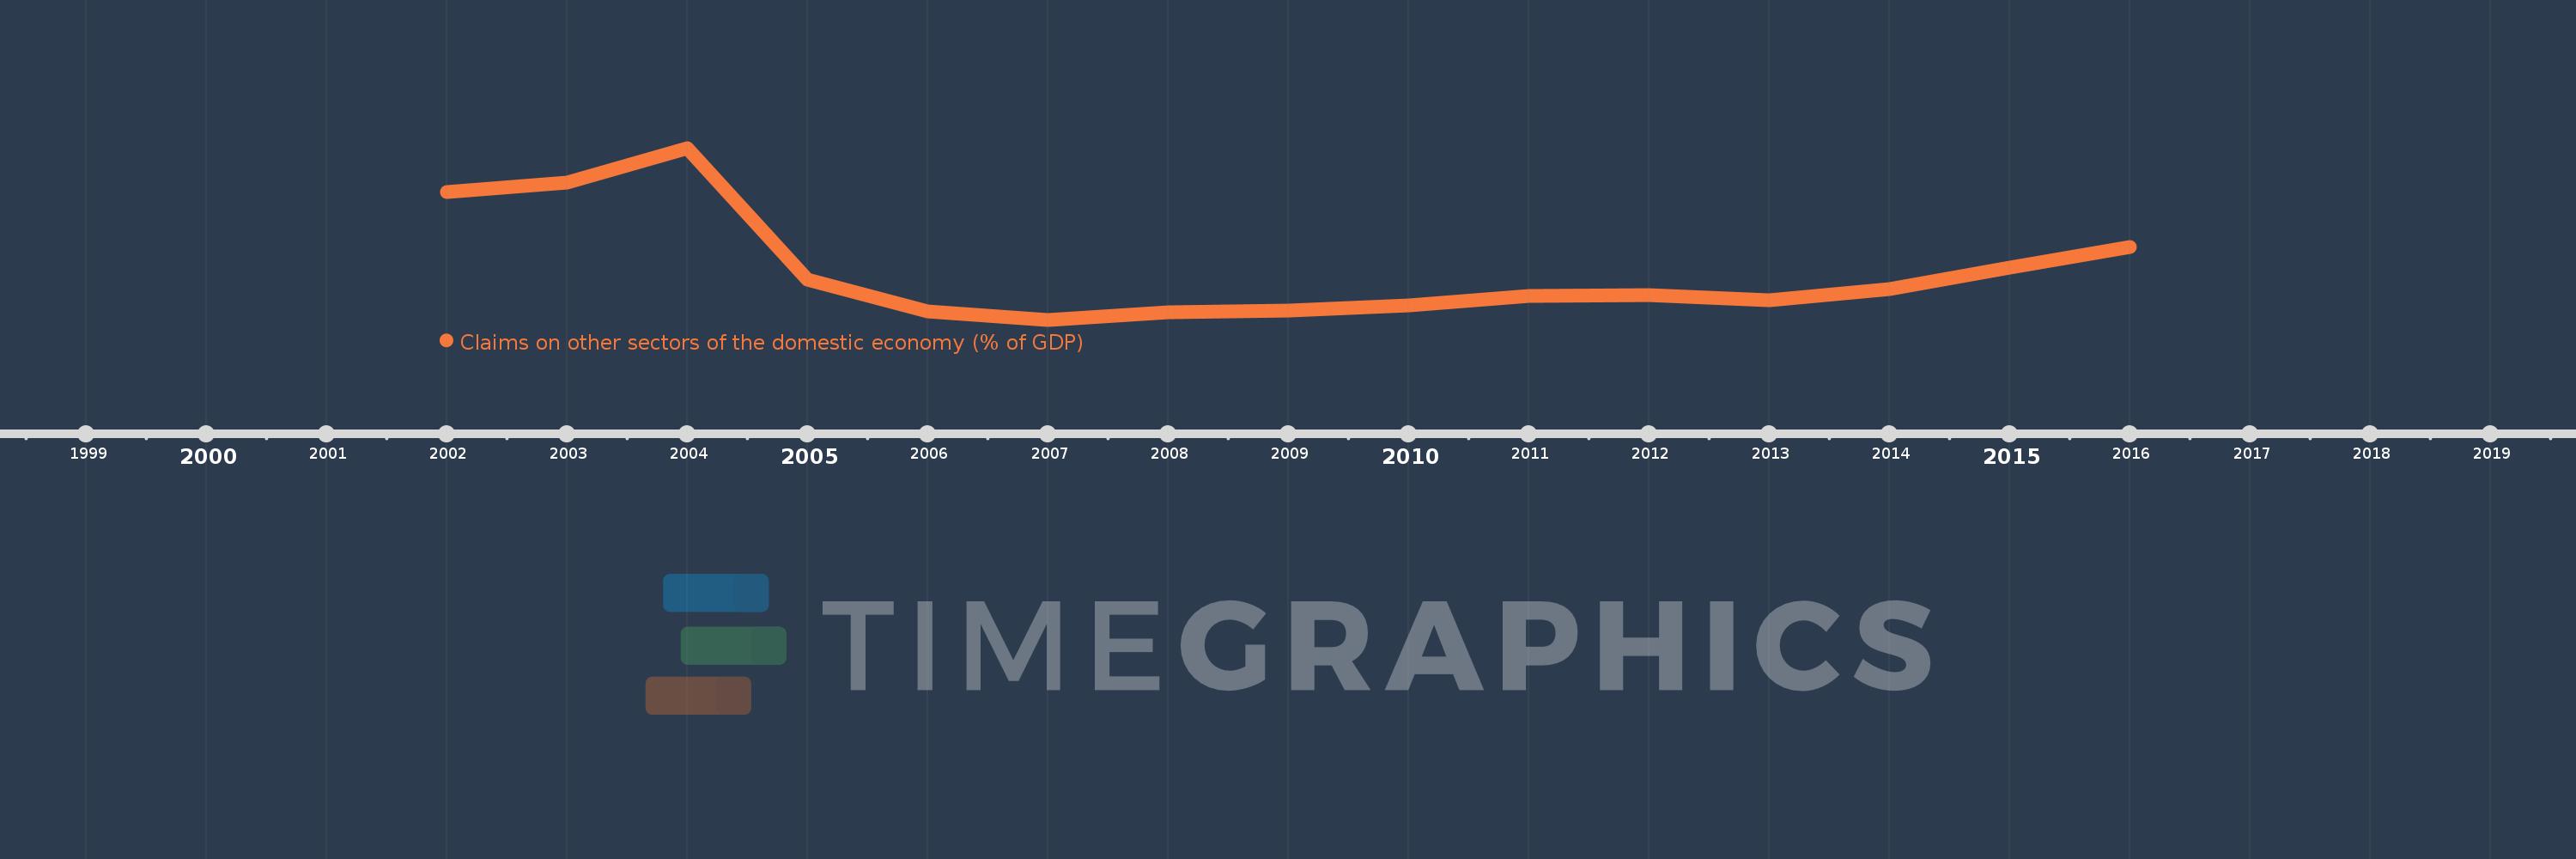
Claims on other sectors of the domestic economy (% of GDP)
2016,2015,2014,2013,2012,2011,2010,2009,2008,2007,2006,2005,2004,2003,2002
This statistics in other country:
Timeline:
This timeline shows a graph from 2002 to 2016 of Dominican Republic. No data until 2001. Number of actual observations by date: 15.
Source name:
World Development Indicators
Source organization:
International Monetary Fund, International Financial Statistics and data files, and World Bank and OECD GDP estimates.
Categories, topics:
Financial Sector
Last updated:
apr 23, 2017
Indicators value changes by year
Maximum:
38.801
jan 1, 2004
At the date of observation
Value
Absolute change
Change from previous value
jan 1, 2002
34.174
+34.174
0.0%
jan 1, 2003
35.192
+1.018
2.98%
jan 1, 2004
38.801
+3.61
10.26%
jan 1, 2005
24.919
-13.883
-35.78%
jan 1, 2006
21.556
-3.363
-13.5%
jan 1, 2007
20.67
-0.885
-4.11%
jan 1, 2008
21.436
+0.766
3.71%
jan 1, 2009
21.607
+0.17
0.79%
jan 1, 2010
22.151
+0.544
2.52%
jan 1, 2011
23.201
+1.05
4.74%
jan 1, 2012
23.311
+0.111
0.48%
jan 1, 2013
22.771
-0.541
-2.32%
jan 1, 2014
23.869
+1.099
4.82%
jan 1, 2015
26.157
+2.288
9.58%
jan 1, 2016
28.371
+2.214
8.47%
Ranking of countries by current statistics by years


Comments: