29
/
en
AIzaSyAYiBZKx7MnpbEhh9jyipgxe19OcubqV5w
April 1, 2024
273312
Ukraine
UKR
true
2
1
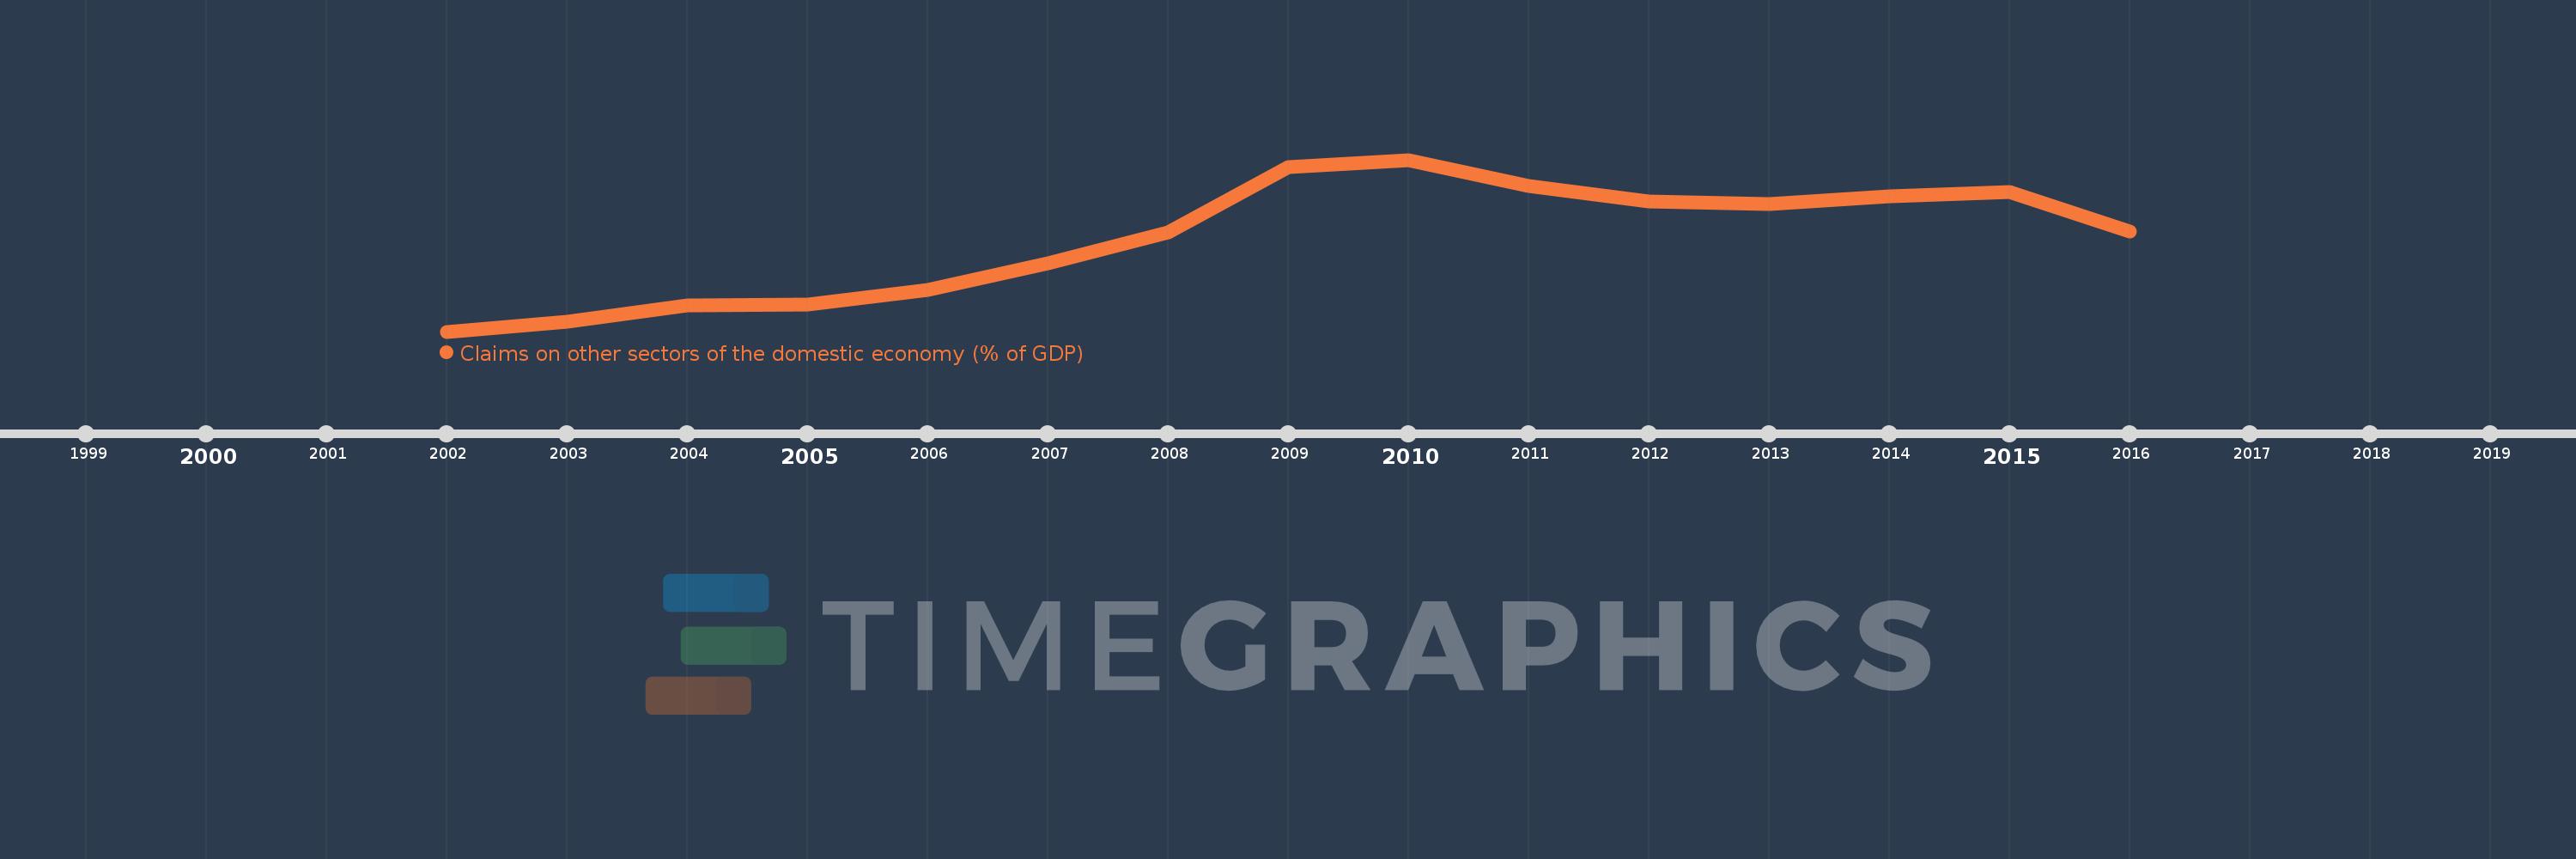
Claims on other sectors of the domestic economy (% of GDP)
2016,2015,2014,2013,2012,2011,2010,2009,2008,2007,2006,2005,2004,2003,2002
This statistics in other country:
Timeline:
This timeline shows a graph from 2002 to 2016 of Ukraine. No data until 2001. Number of actual observations by date: 15.
Source name:
World Development Indicators
Source organization:
International Monetary Fund, International Financial Statistics and data files, and World Bank and OECD GDP estimates.
Categories, topics:
Financial Sector
Last updated:
apr 23, 2017
Indicators value changes by year
Maximum:
95.694
jan 1, 2010
At the date of observation
Value
Absolute change
Change from previous value
jan 1, 2002
14.72
+14.72
0.0%
jan 1, 2003
19.572
+4.852
32.97%
jan 1, 2004
27.159
+7.587
38.77%
jan 1, 2005
27.452
+0.292
1.08%
jan 1, 2006
34.55
+7.098
25.86%
jan 1, 2007
46.933
+12.383
35.84%
jan 1, 2008
61.543
+14.609
31.13%
jan 1, 2009
92.428
+30.885
50.19%
jan 1, 2010
95.694
+3.266
3.53%
jan 1, 2011
83.478
-12.215
-12.77%
jan 1, 2012
75.981
-7.498
-8.98%
jan 1, 2013
74.699
-1.281
-1.69%
jan 1, 2014
78.328
+3.628
4.86%
jan 1, 2015
80.542
+2.215
2.83%
jan 1, 2016
62.025
-18.517
-22.99%
Ranking of countries by current statistics by years


Comments: