29
/
en
AIzaSyAYiBZKx7MnpbEhh9jyipgxe19OcubqV5w
April 1, 2024
135296
Gabon
GAB
true
2
1
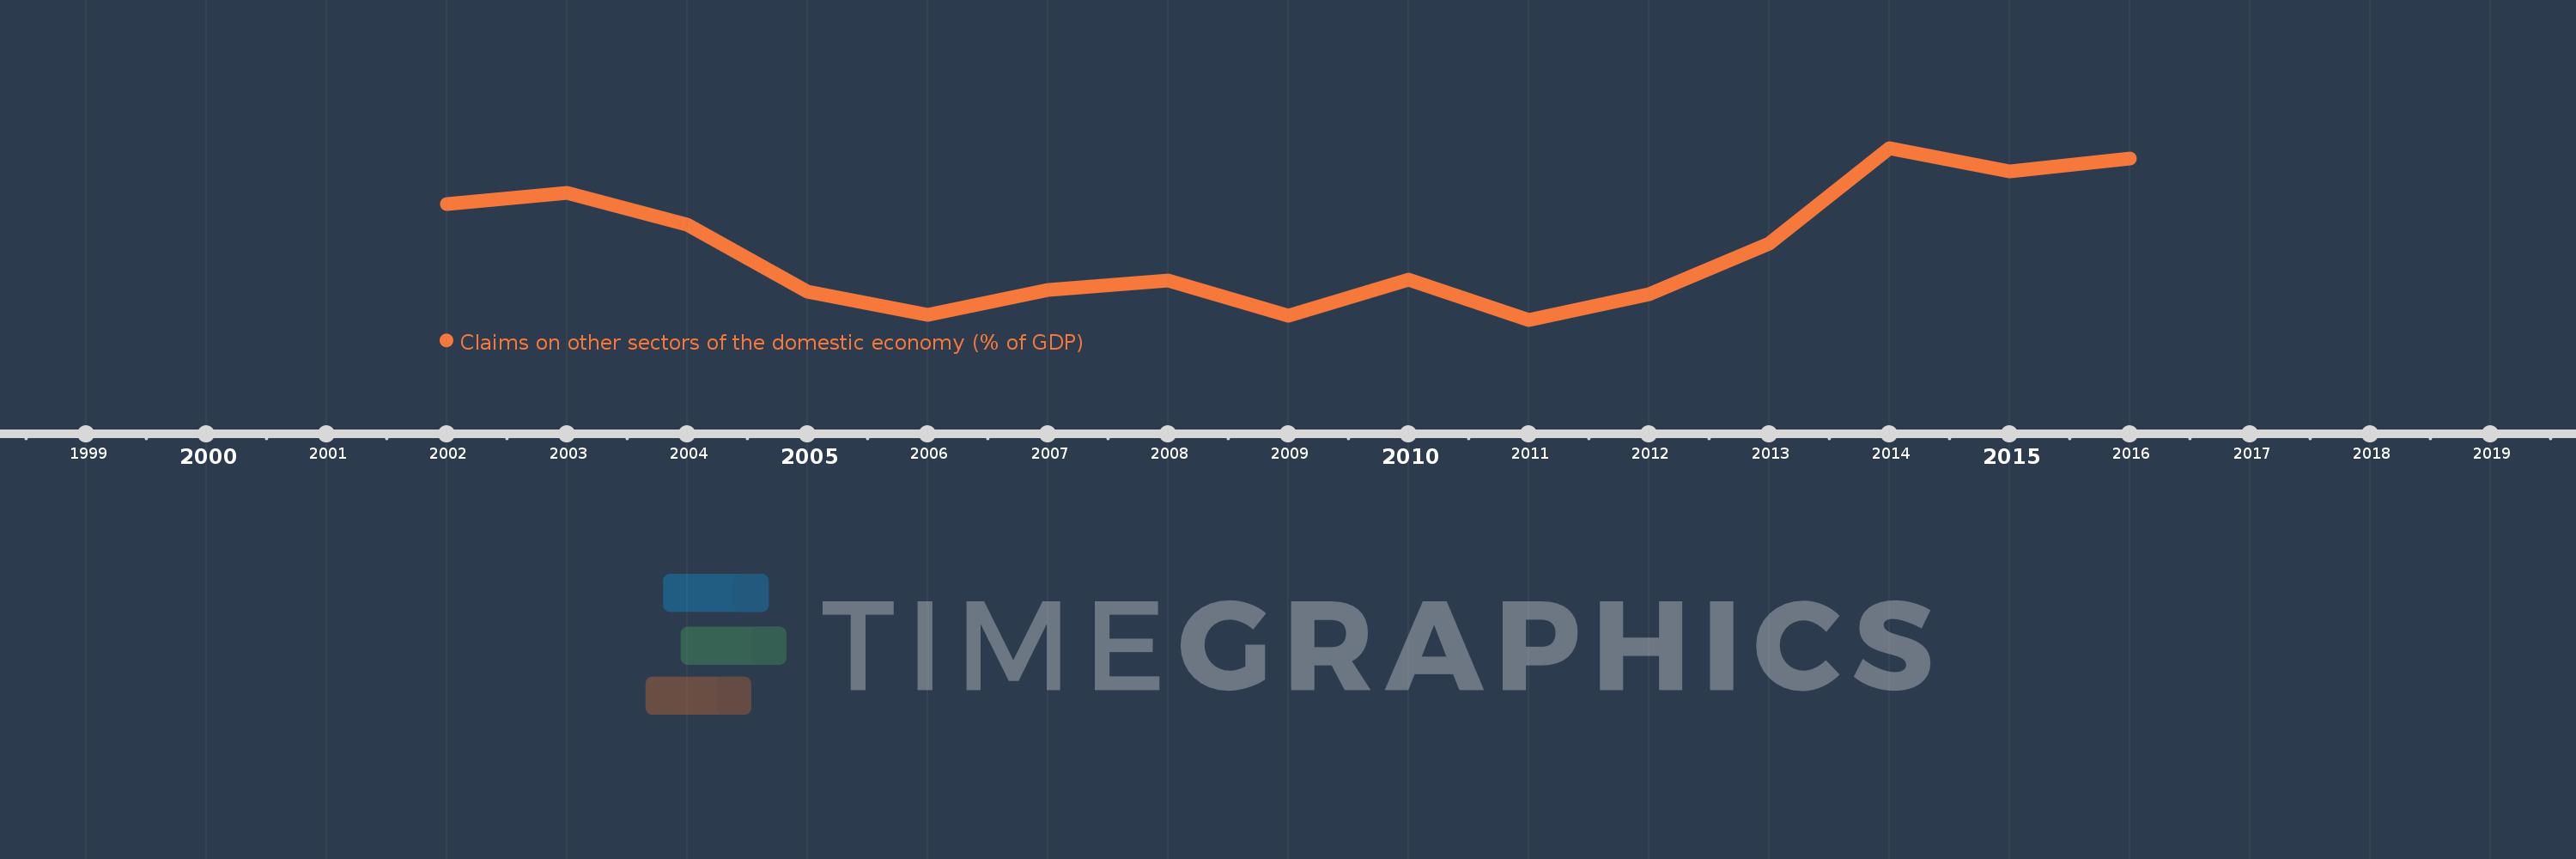
Claims on other sectors of the domestic economy (% of GDP)
2016,2015,2014,2013,2012,2011,2010,2009,2008,2007,2006,2005,2004,2003,2002
This statistics in other country:
Timeline:
This timeline shows a graph from 2002 to 2016 of Gabon. No data until 2001. Number of actual observations by date: 15.
Source name:
World Development Indicators
Source organization:
International Monetary Fund, International Financial Statistics and data files, and World Bank and OECD GDP estimates.
Categories, topics:
Financial Sector
Last updated:
apr 23, 2017
Indicators value changes by year
Maximum:
16.441
jan 1, 2014
At the date of observation
Value
Absolute change
Change from previous value
jan 1, 2002
13.95
+13.95
0.0%
jan 1, 2003
14.434
+0.484
3.47%
jan 1, 2004
13.011
-1.424
-9.86%
jan 1, 2005
10.032
-2.979
-22.89%
jan 1, 2006
8.997
-1.035
-10.32%
jan 1, 2007
10.106
+1.109
12.33%
jan 1, 2008
10.534
+0.428
4.24%
jan 1, 2009
8.956
-1.578
-14.98%
jan 1, 2010
10.56
+1.604
17.91%
jan 1, 2011
8.773
-1.787
-16.92%
jan 1, 2012
9.917
+1.144
13.04%
jan 1, 2013
12.171
+2.254
22.73%
jan 1, 2014
16.441
+4.27
35.08%
jan 1, 2015
15.403
-1.037
-6.31%
jan 1, 2016
15.97
+0.566
3.68%
Ranking of countries by current statistics by years


Comments: