29
/
en
AIzaSyAYiBZKx7MnpbEhh9jyipgxe19OcubqV5w
April 1, 2024
274590
United Arab Emirates
ARE
true
2
1
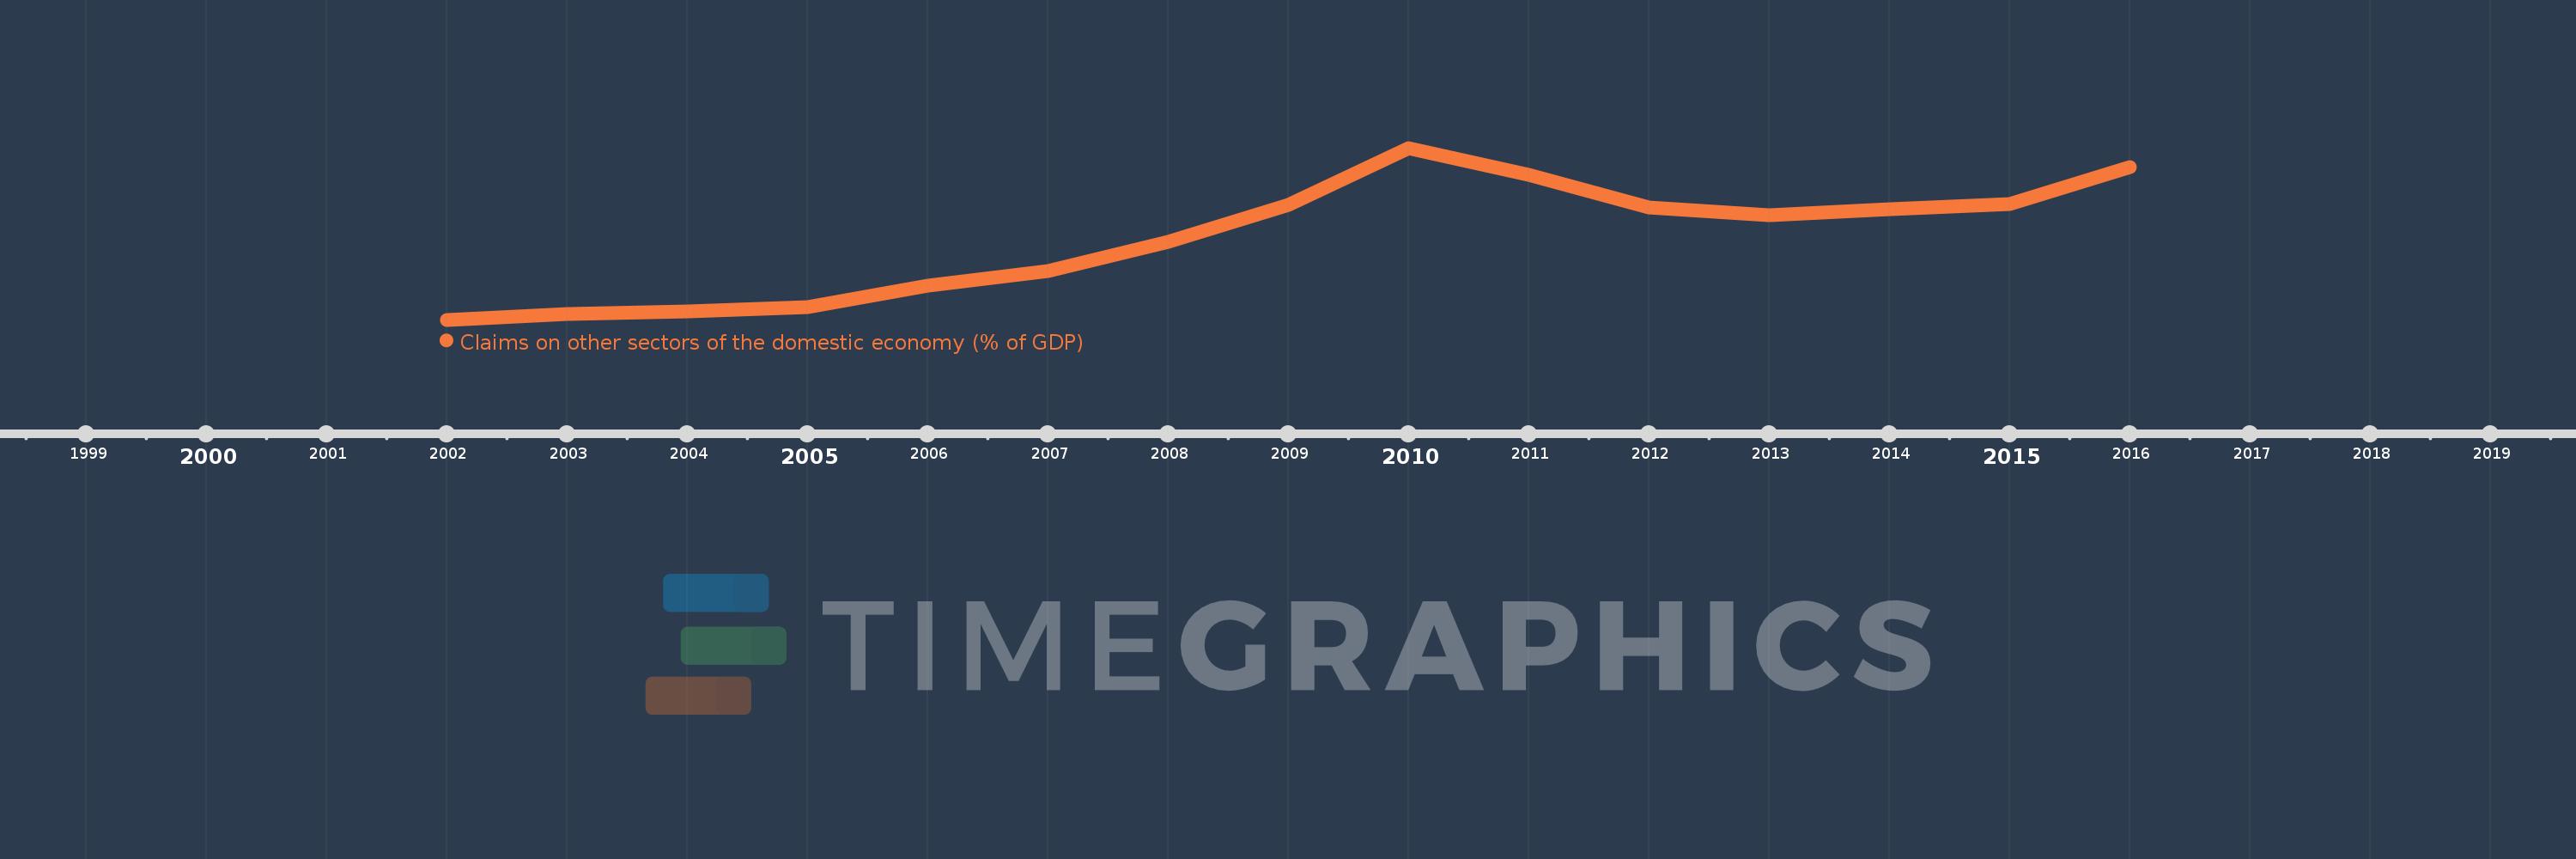
Claims on other sectors of the domestic economy (% of GDP)
2016,2015,2014,2013,2012,2011,2010,2009,2008,2007,2006,2005,2004,2003,2002
This statistics in other country:
Timeline:
This timeline shows a graph from 2002 to 2016 of United Arab Emirates. No data until 2001. Number of actual observations by date: 15.
Source name:
World Development Indicators
Source organization:
International Monetary Fund, International Financial Statistics and data files, and World Bank and OECD GDP estimates.
Categories, topics:
Financial Sector
Last updated:
apr 23, 2017
Indicators value changes by year
Minimum:
36.702
jan 1, 2002
Maximum:
102.589
jan 1, 2010
At the date of observation
Value
Absolute change
Change from previous value
jan 1, 2002
36.702
+36.702
0.0%
jan 1, 2003
38.797
+2.095
5.71%
jan 1, 2004
39.955
+1.158
2.98%
jan 1, 2005
41.499
+1.544
3.86%
jan 1, 2006
49.802
+8.303
20.01%
jan 1, 2007
55.31
+5.508
11.06%
jan 1, 2008
66.658
+11.348
20.52%
jan 1, 2009
80.907
+14.249
21.38%
jan 1, 2010
102.589
+21.683
26.8%
jan 1, 2011
92.415
-10.174
-9.92%
jan 1, 2012
79.803
-12.612
-13.65%
jan 1, 2013
76.837
-2.966
-3.72%
jan 1, 2014
79.177
+2.34
3.04%
jan 1, 2015
81.164
+1.987
2.51%
jan 1, 2016
95.172
+14.008
17.26%
Ranking of countries by current statistics by years


Comments: